Completion Tools
Front End Developer | Multimedia Designer
Halliburton
Jun. 2008 – Jan. 2014
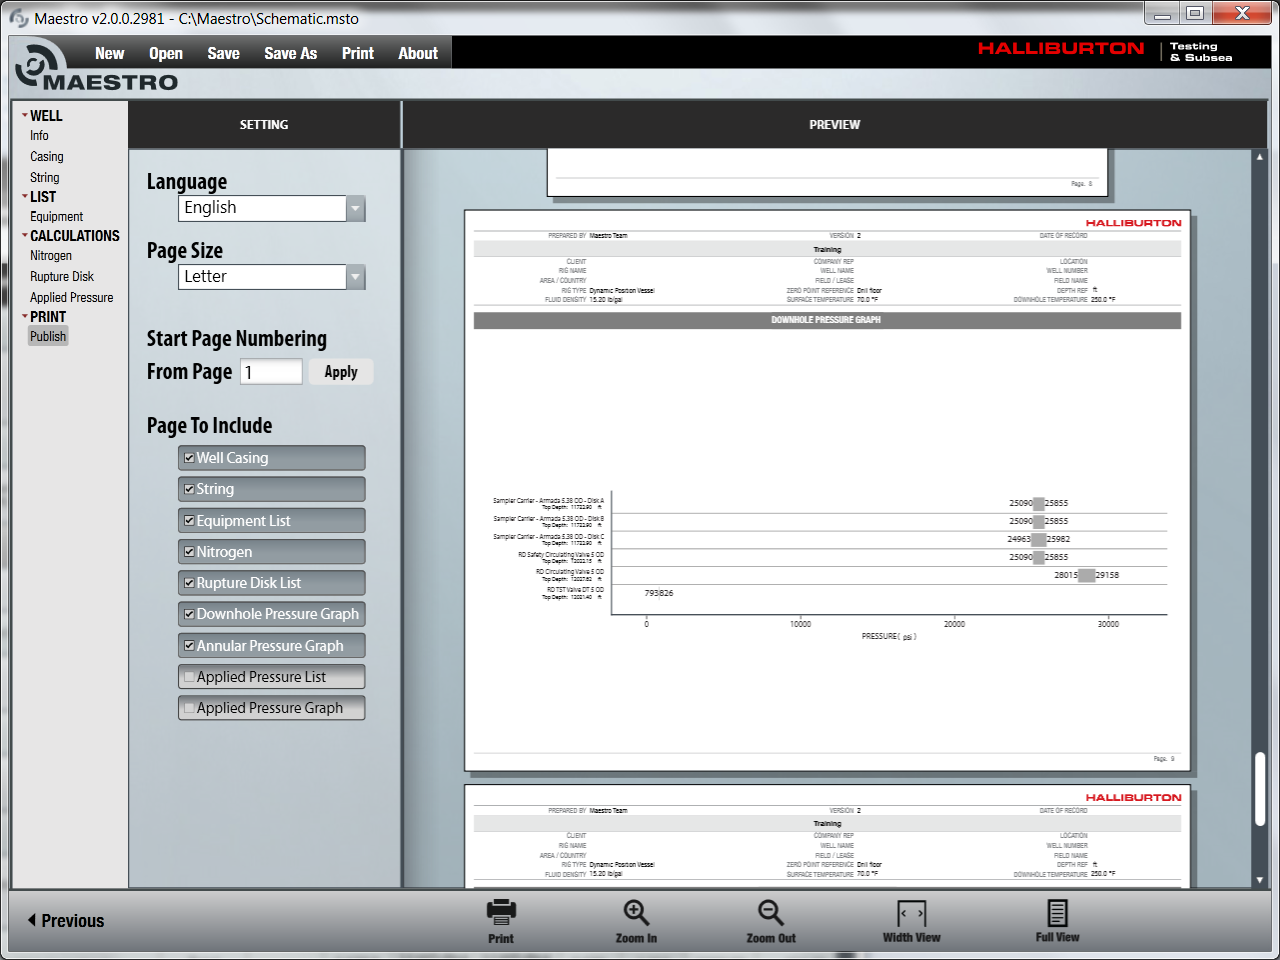
I worked as a Front-End Developer | Multimedia Designer to enhance the user experience of complex calculation software for the oil field industry, a role where I discovered my passion for software development. I successfully implemented a variety of software solutions, ranging from a report generator to an interactive pressure calculation tool using Unity 3D. Additionally, I produced several 3D animations to demonstrate the tool’s functionality in a downhole environment. One of these animations played a key role in securing a $5 million contract.
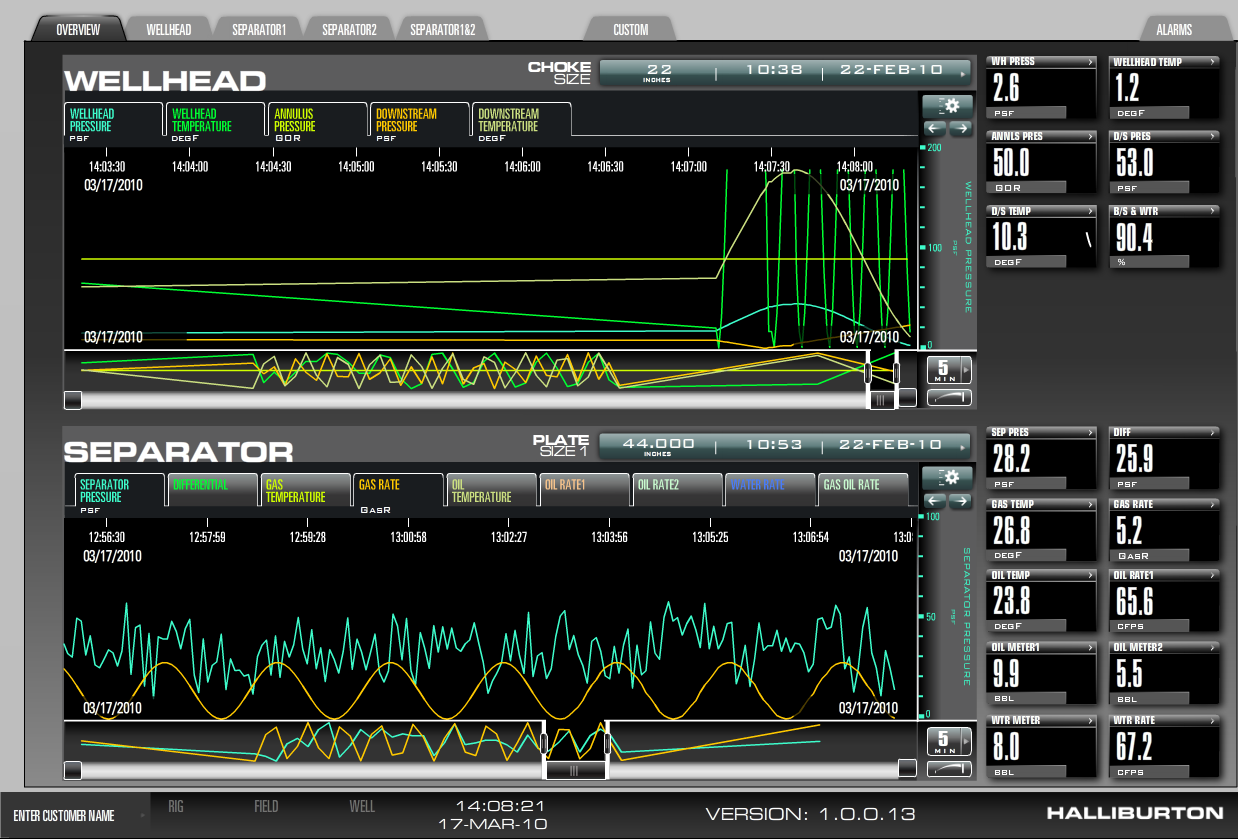
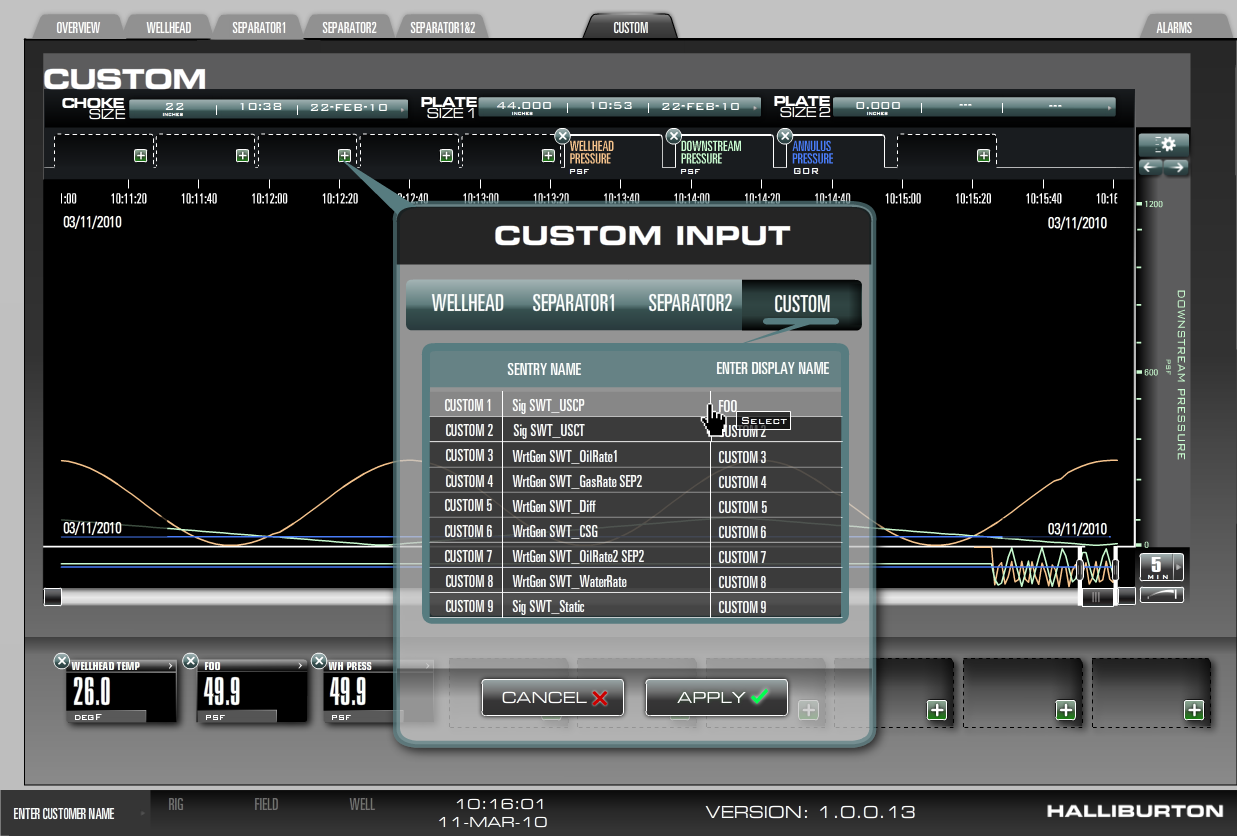
REAL TIME DATA TRACKING
– View 30,000 feet below like in front of your eyes
Welltesting HMI displays real-time data sent from equipment 30,000 feet below, allowing users to analyze and monitor downhole conditions as if they were right in front of them. Key features for an optimal user experience include the ability to turn data trends on and off, view trends without delays, and utilize zoom and scaling options.
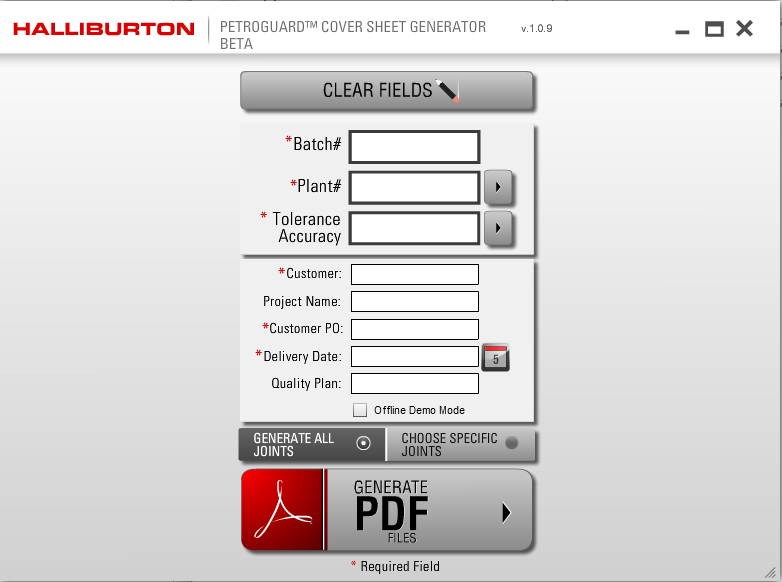
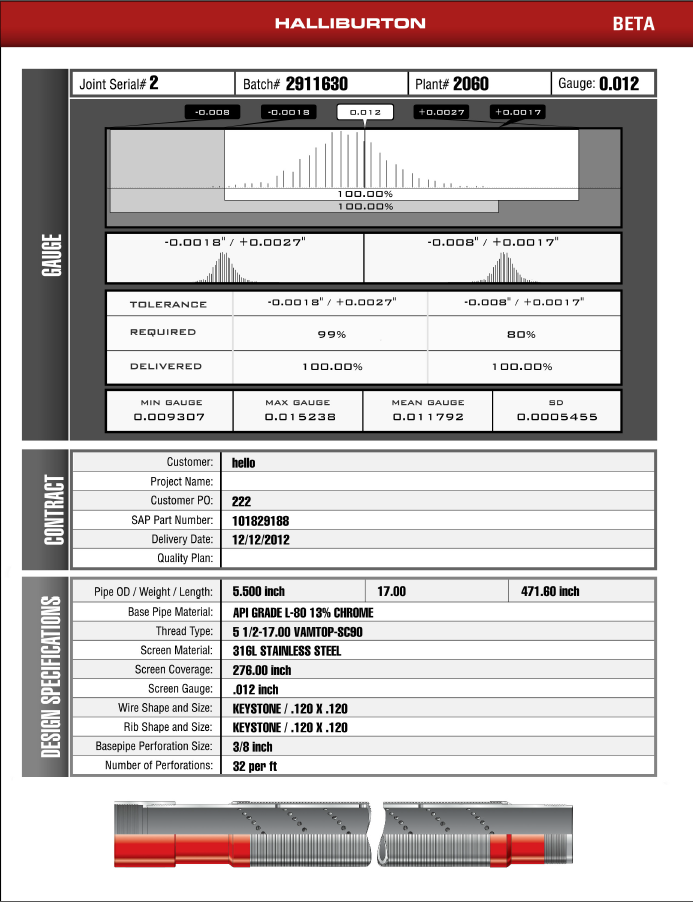
BATCH QUALITY VISUALIZER
– Stay in the curve, quality at a glance
Petroguard threshold report retrieves wire mesh gauge distance measurements captured by the laser from the ERP and displays in the normal distribution curve along with the corresponding specification requirements, providing an at-a-glance view to ensure product quality is met.
TOOL VISUALIZER
– Design tools like building a lego
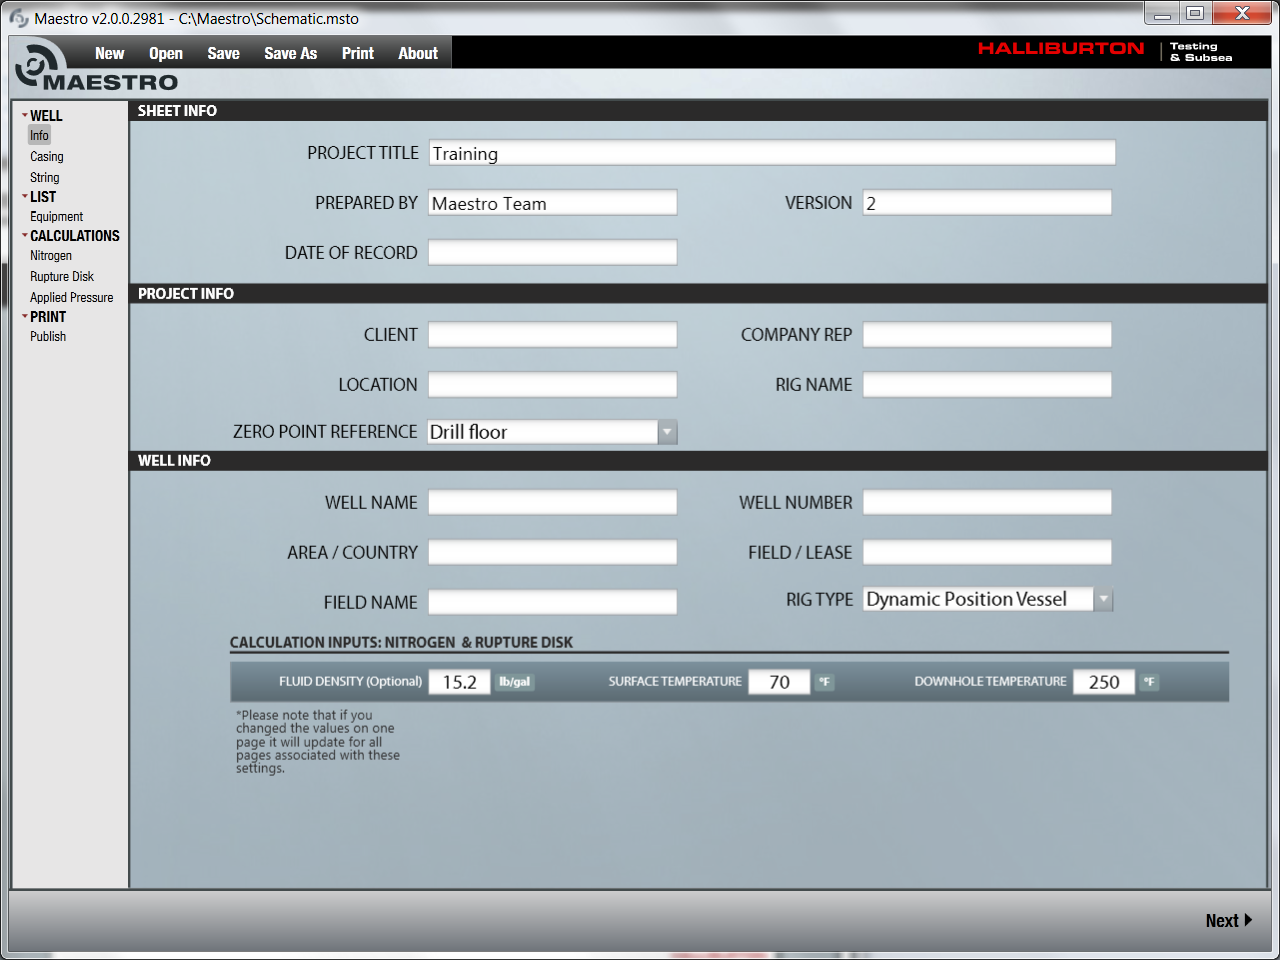
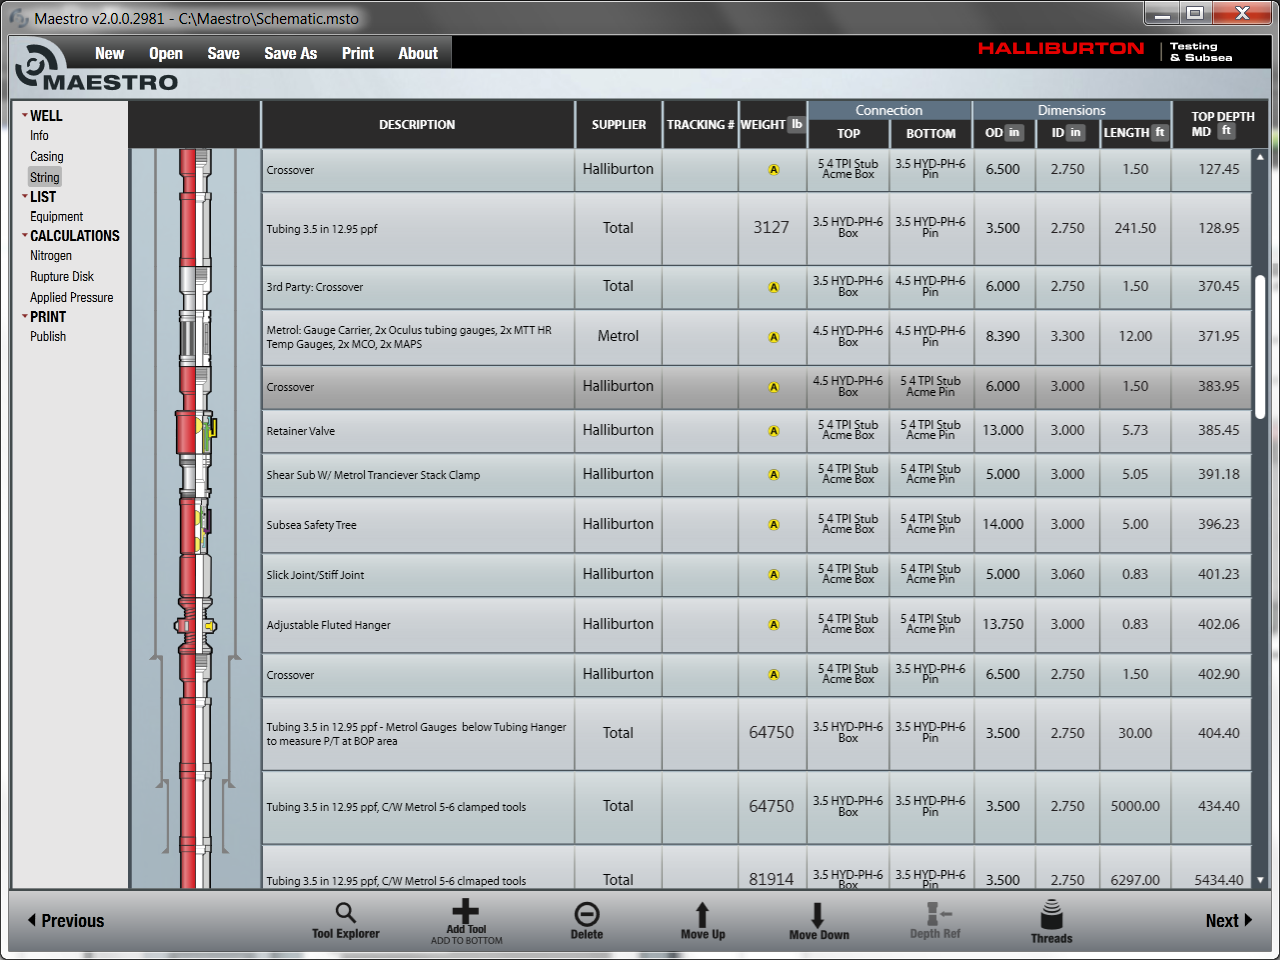
Maestro pipe builder lets you build a new set of tool by connecting different sets of pipes and visualizing the final design to ensure what you’re designing works for customer’s well.
WELL PRESSURE VISUALIZER
– Have you seen a pressure of a well 30,000 feet deep?
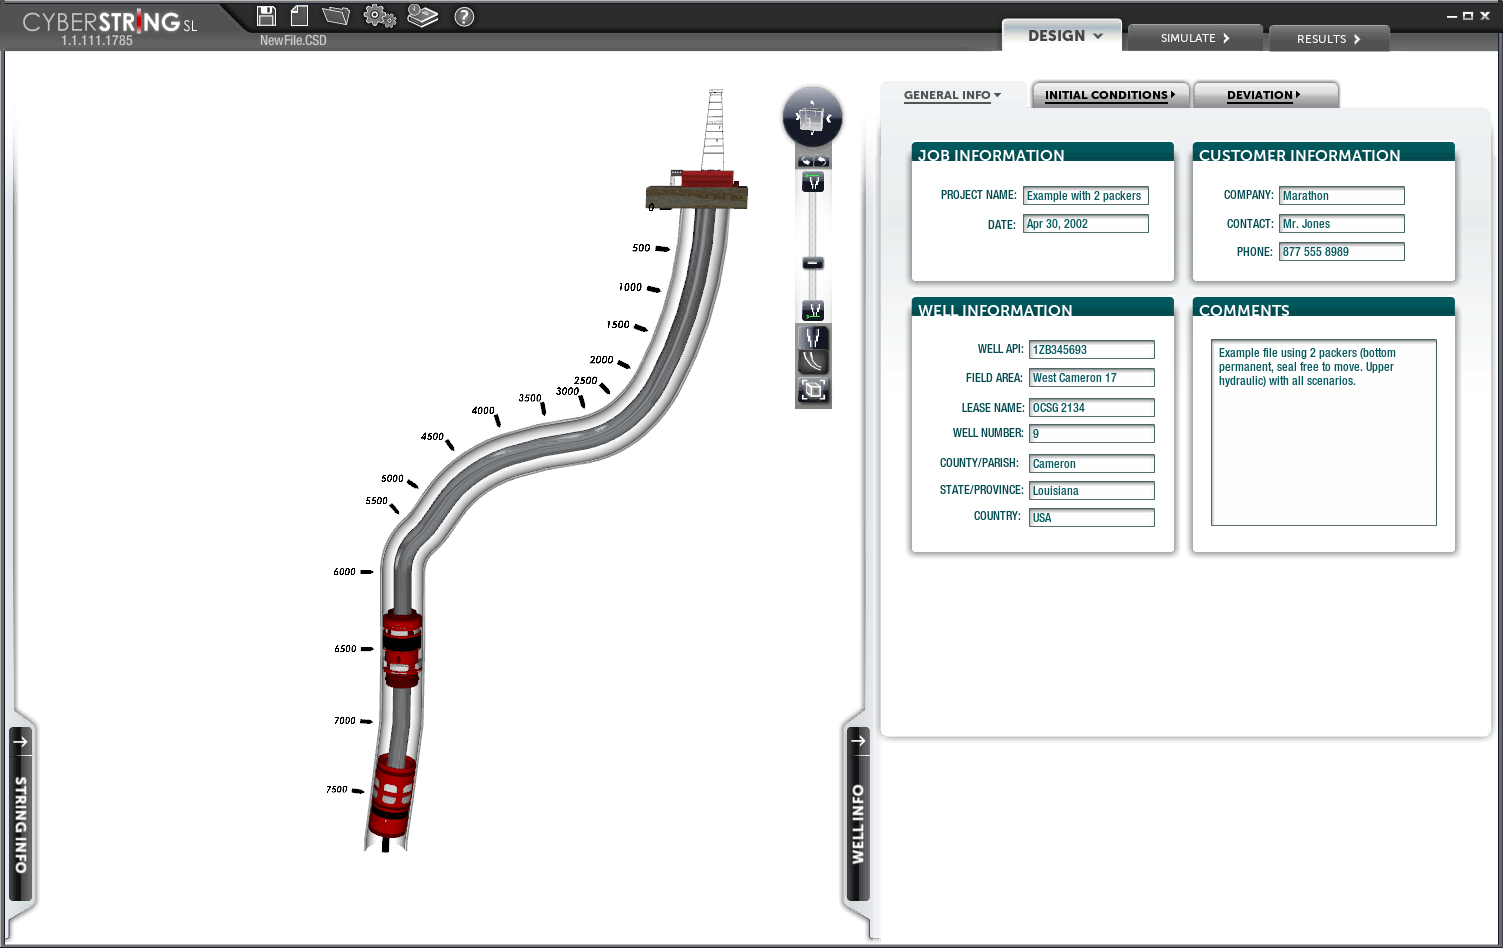
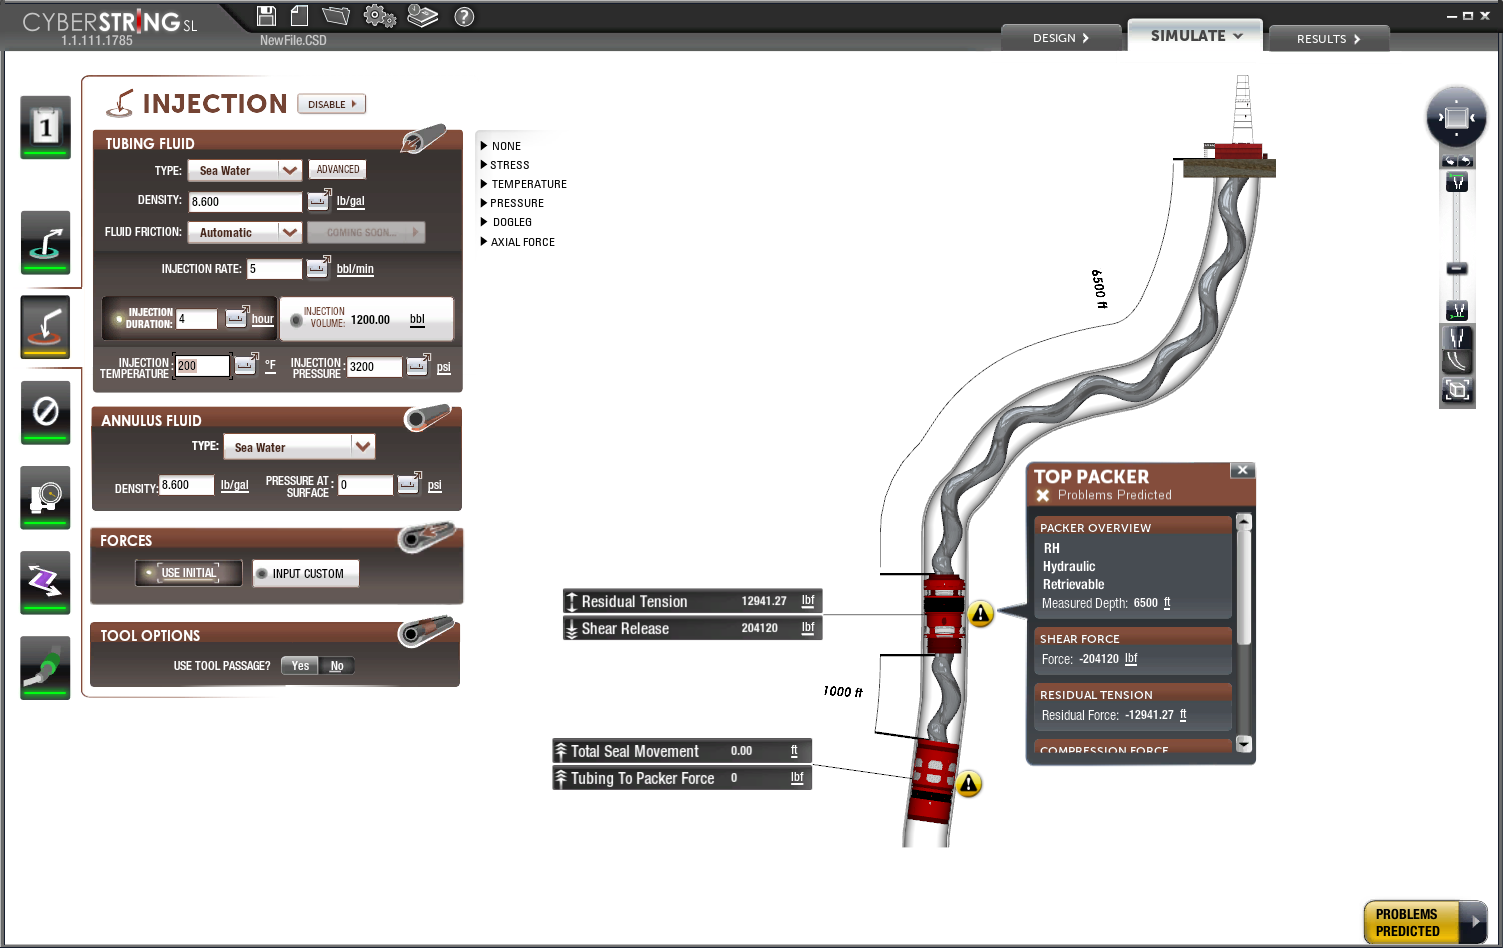
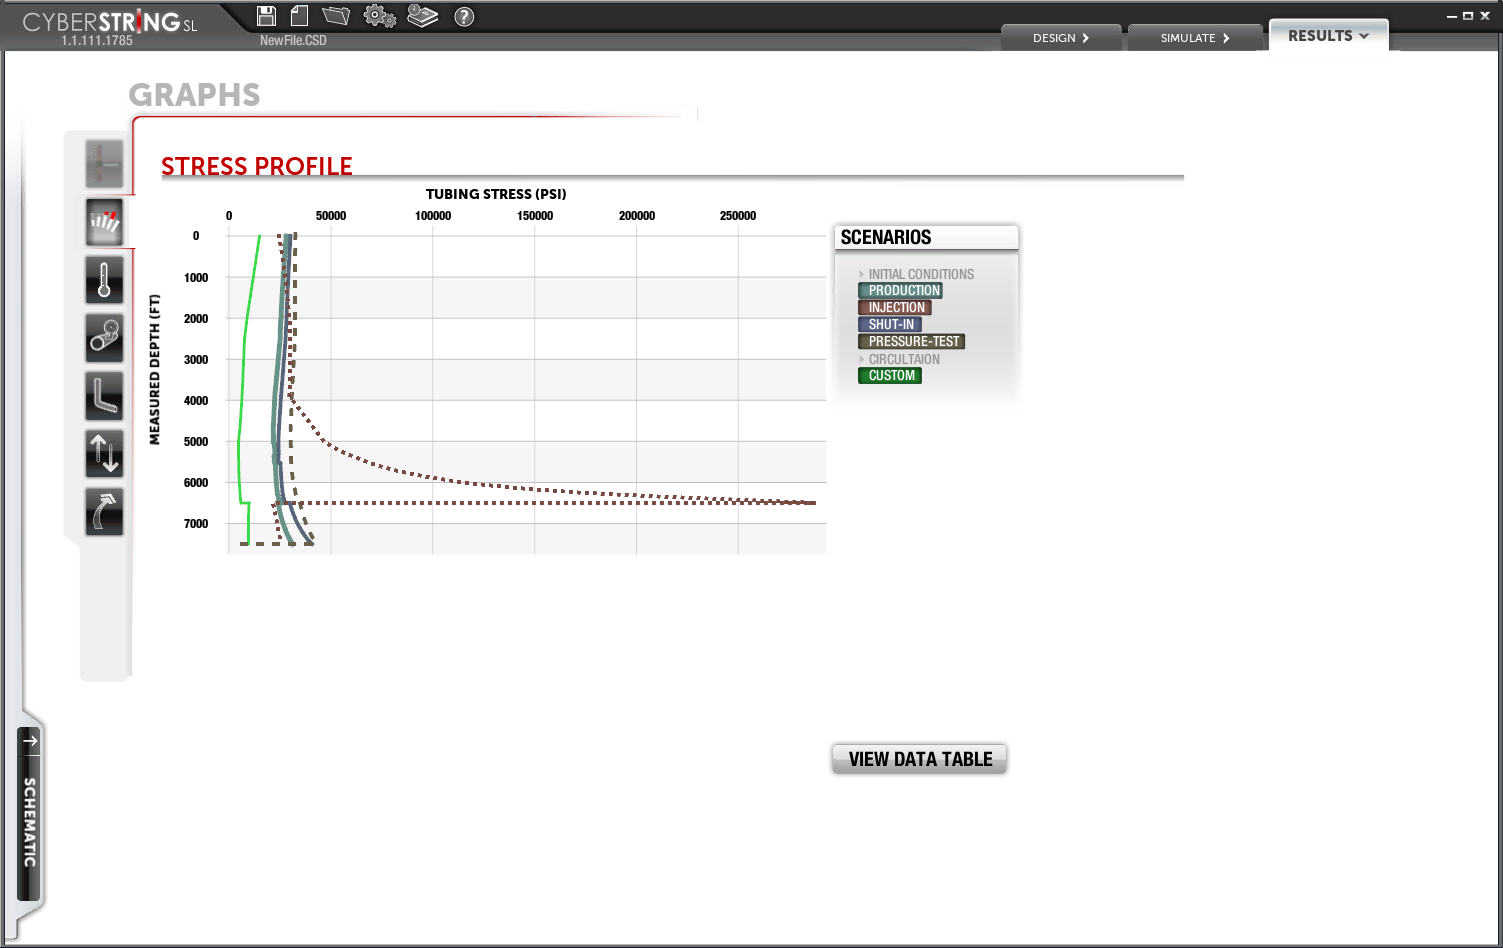
Many oil wells are not perfectly vertical. Cyberstring uses the Unity 3D engine to visualize the customer’s well in 3D, allowing them to assess whether the tool configuration can withstand the pressure by highlighting weak spots and risky areas.
3D ANIMATION
– Seeing is believing
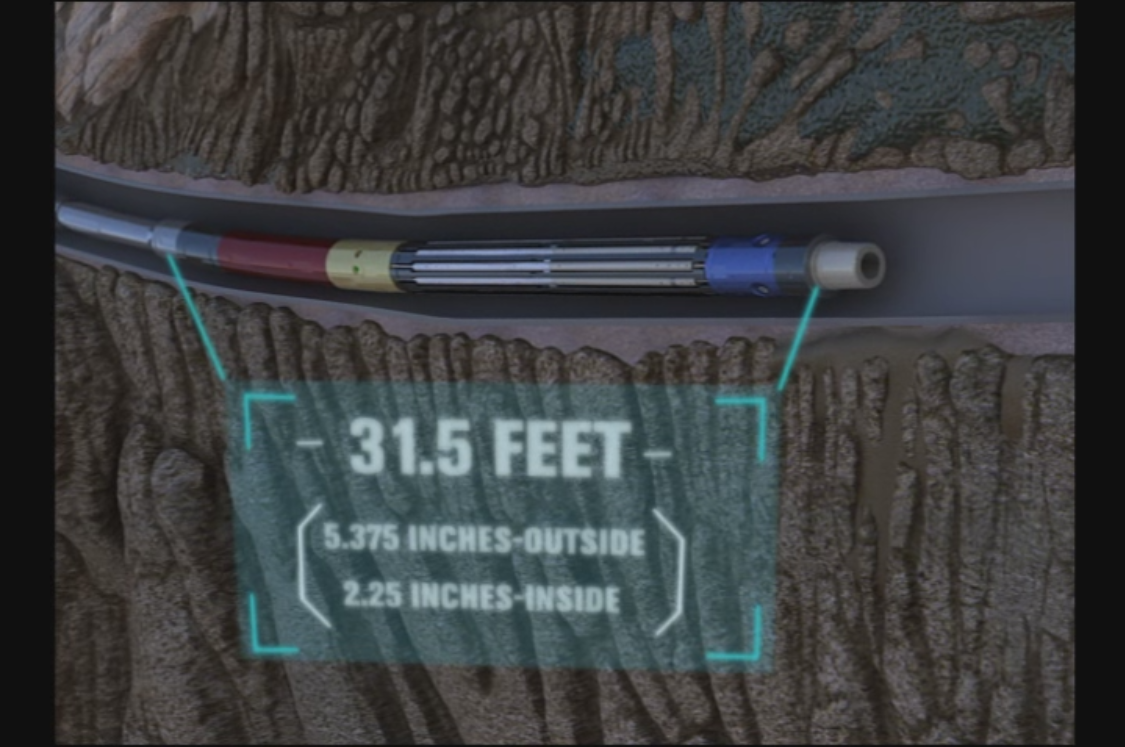
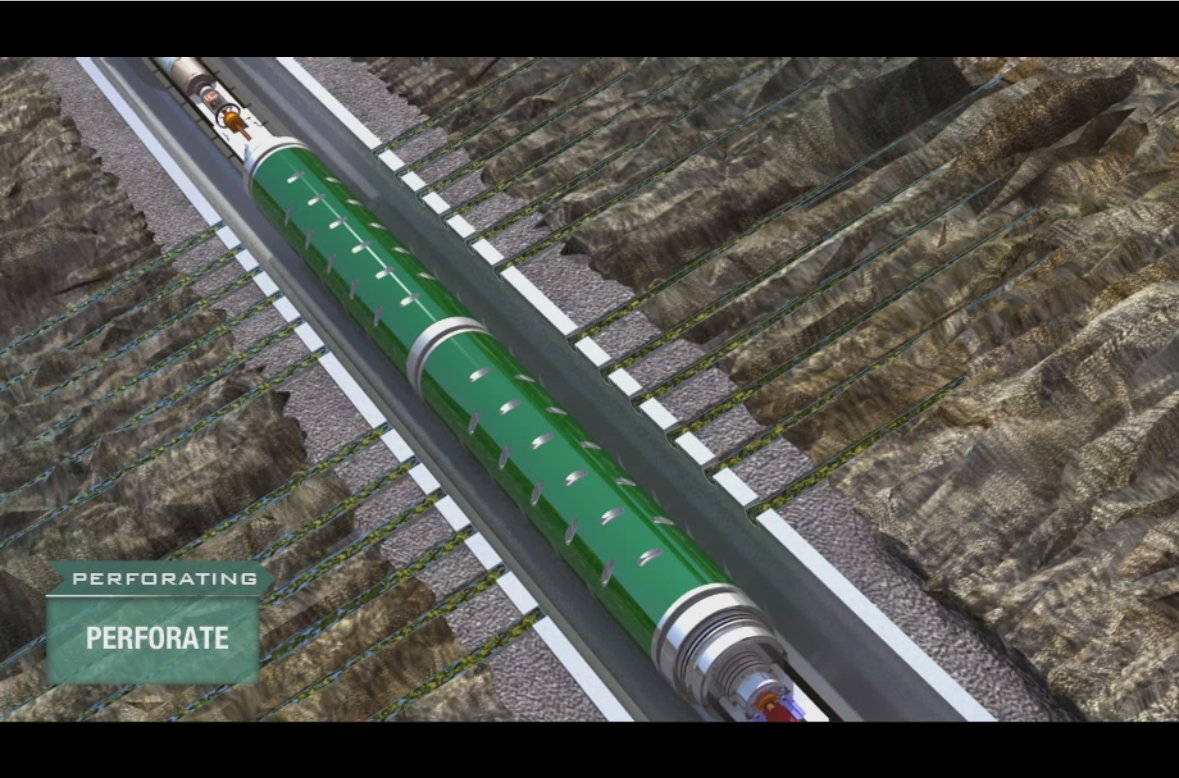
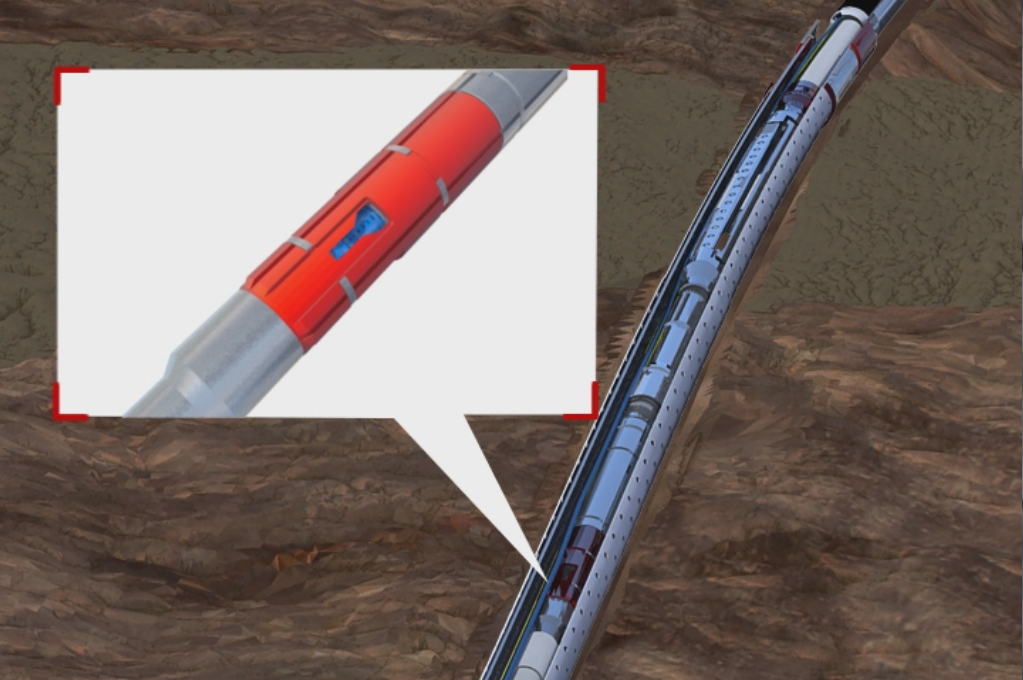
To demonstrate how the tool operates in environments inaccessible to humans, animation becomes a valuable asset.
For example, the tool can be shown in cross-section to reveal its internal locking mechanism, or the ground itself can be split open to illustrate how the tool is inserted, activated, and functions. Animation also allows for on-demand zoom-ins and 3D views of the tool, showcasing features that are otherwise difficult to visualize.
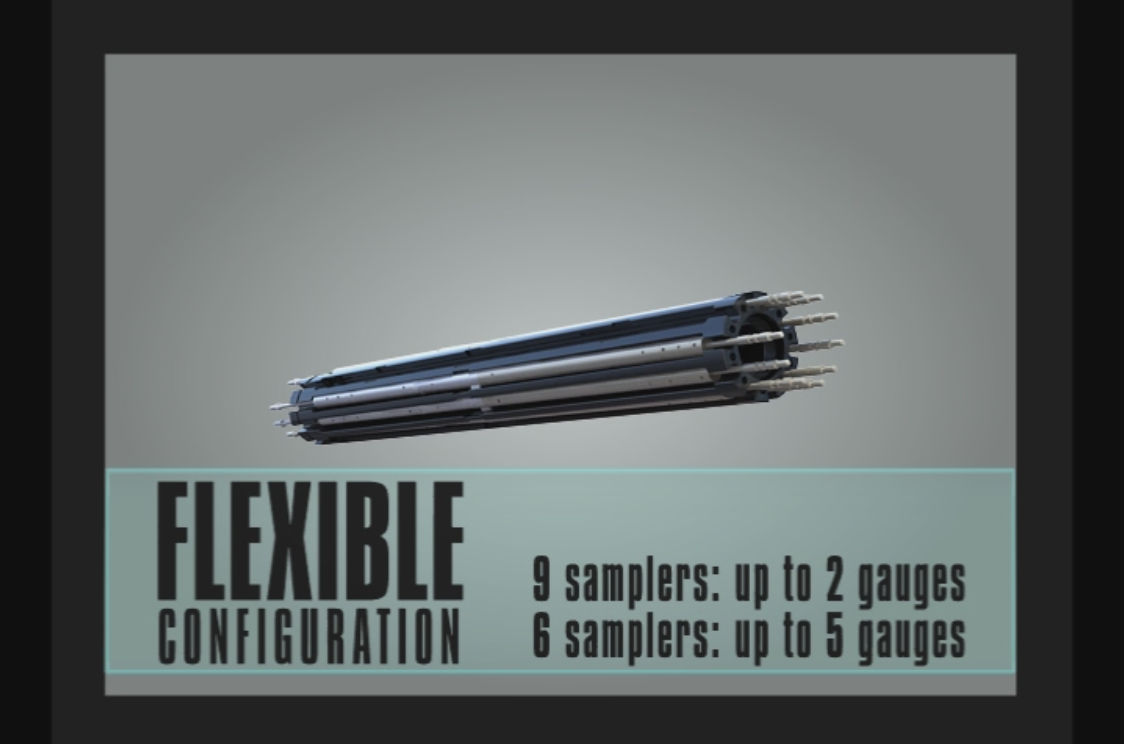
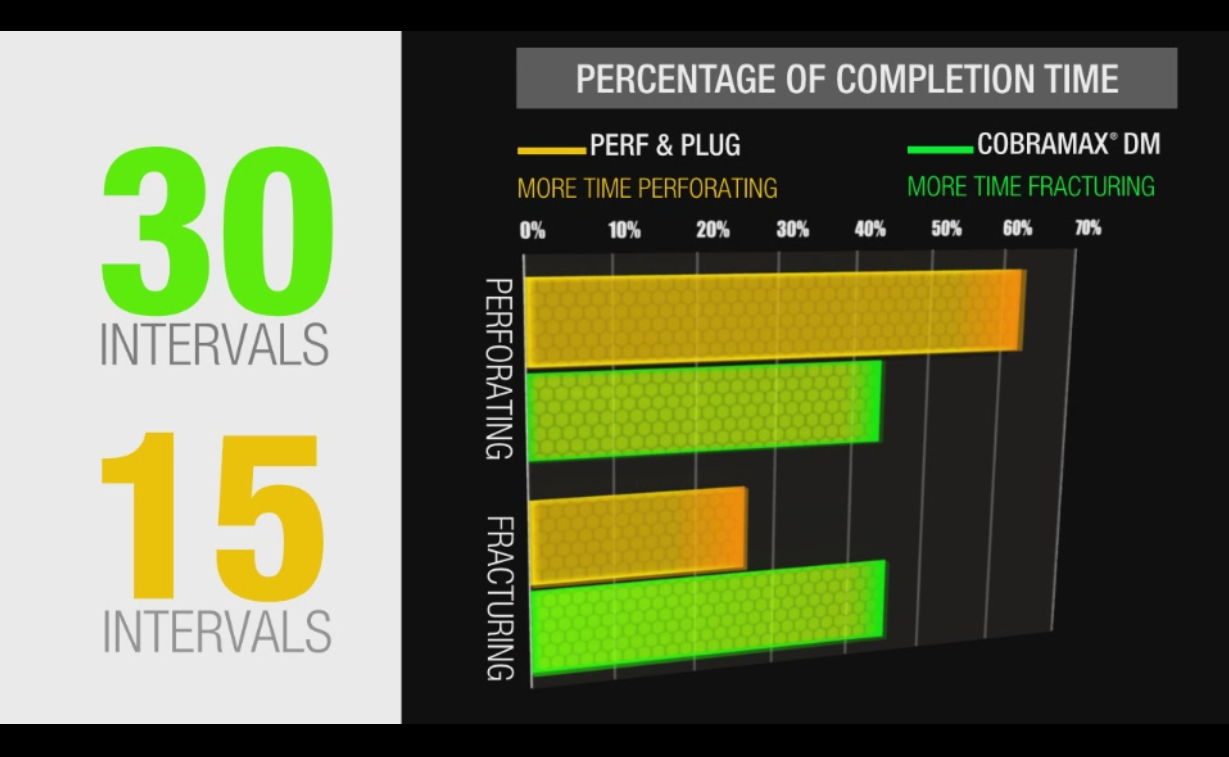
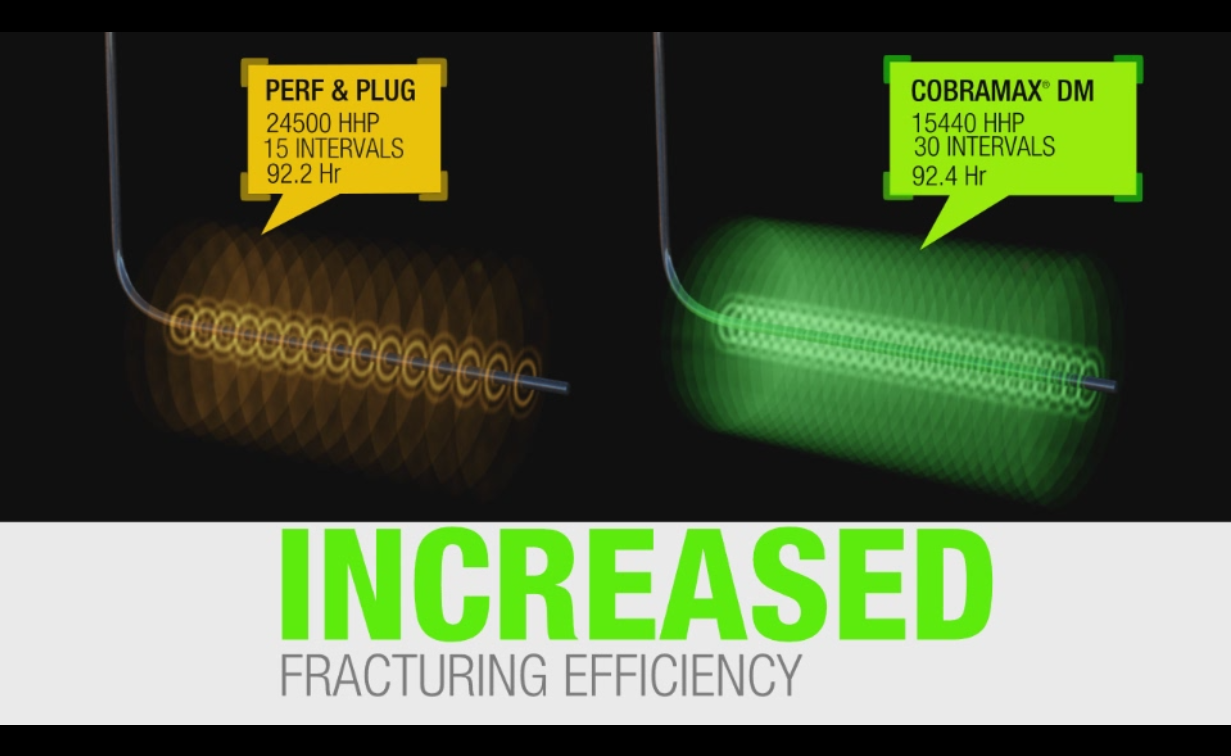
It can also highlight contingency mechanisms without needing to simulate real-world conditions. Finally yet importantly, key phrases and supporting data can be overlaid to emphasize the tool’s unique advantages and clearly differentiate it from competitors.
