ESP
UI / UX Design Lead
L7 Informatics
Sep. 2022 – Current
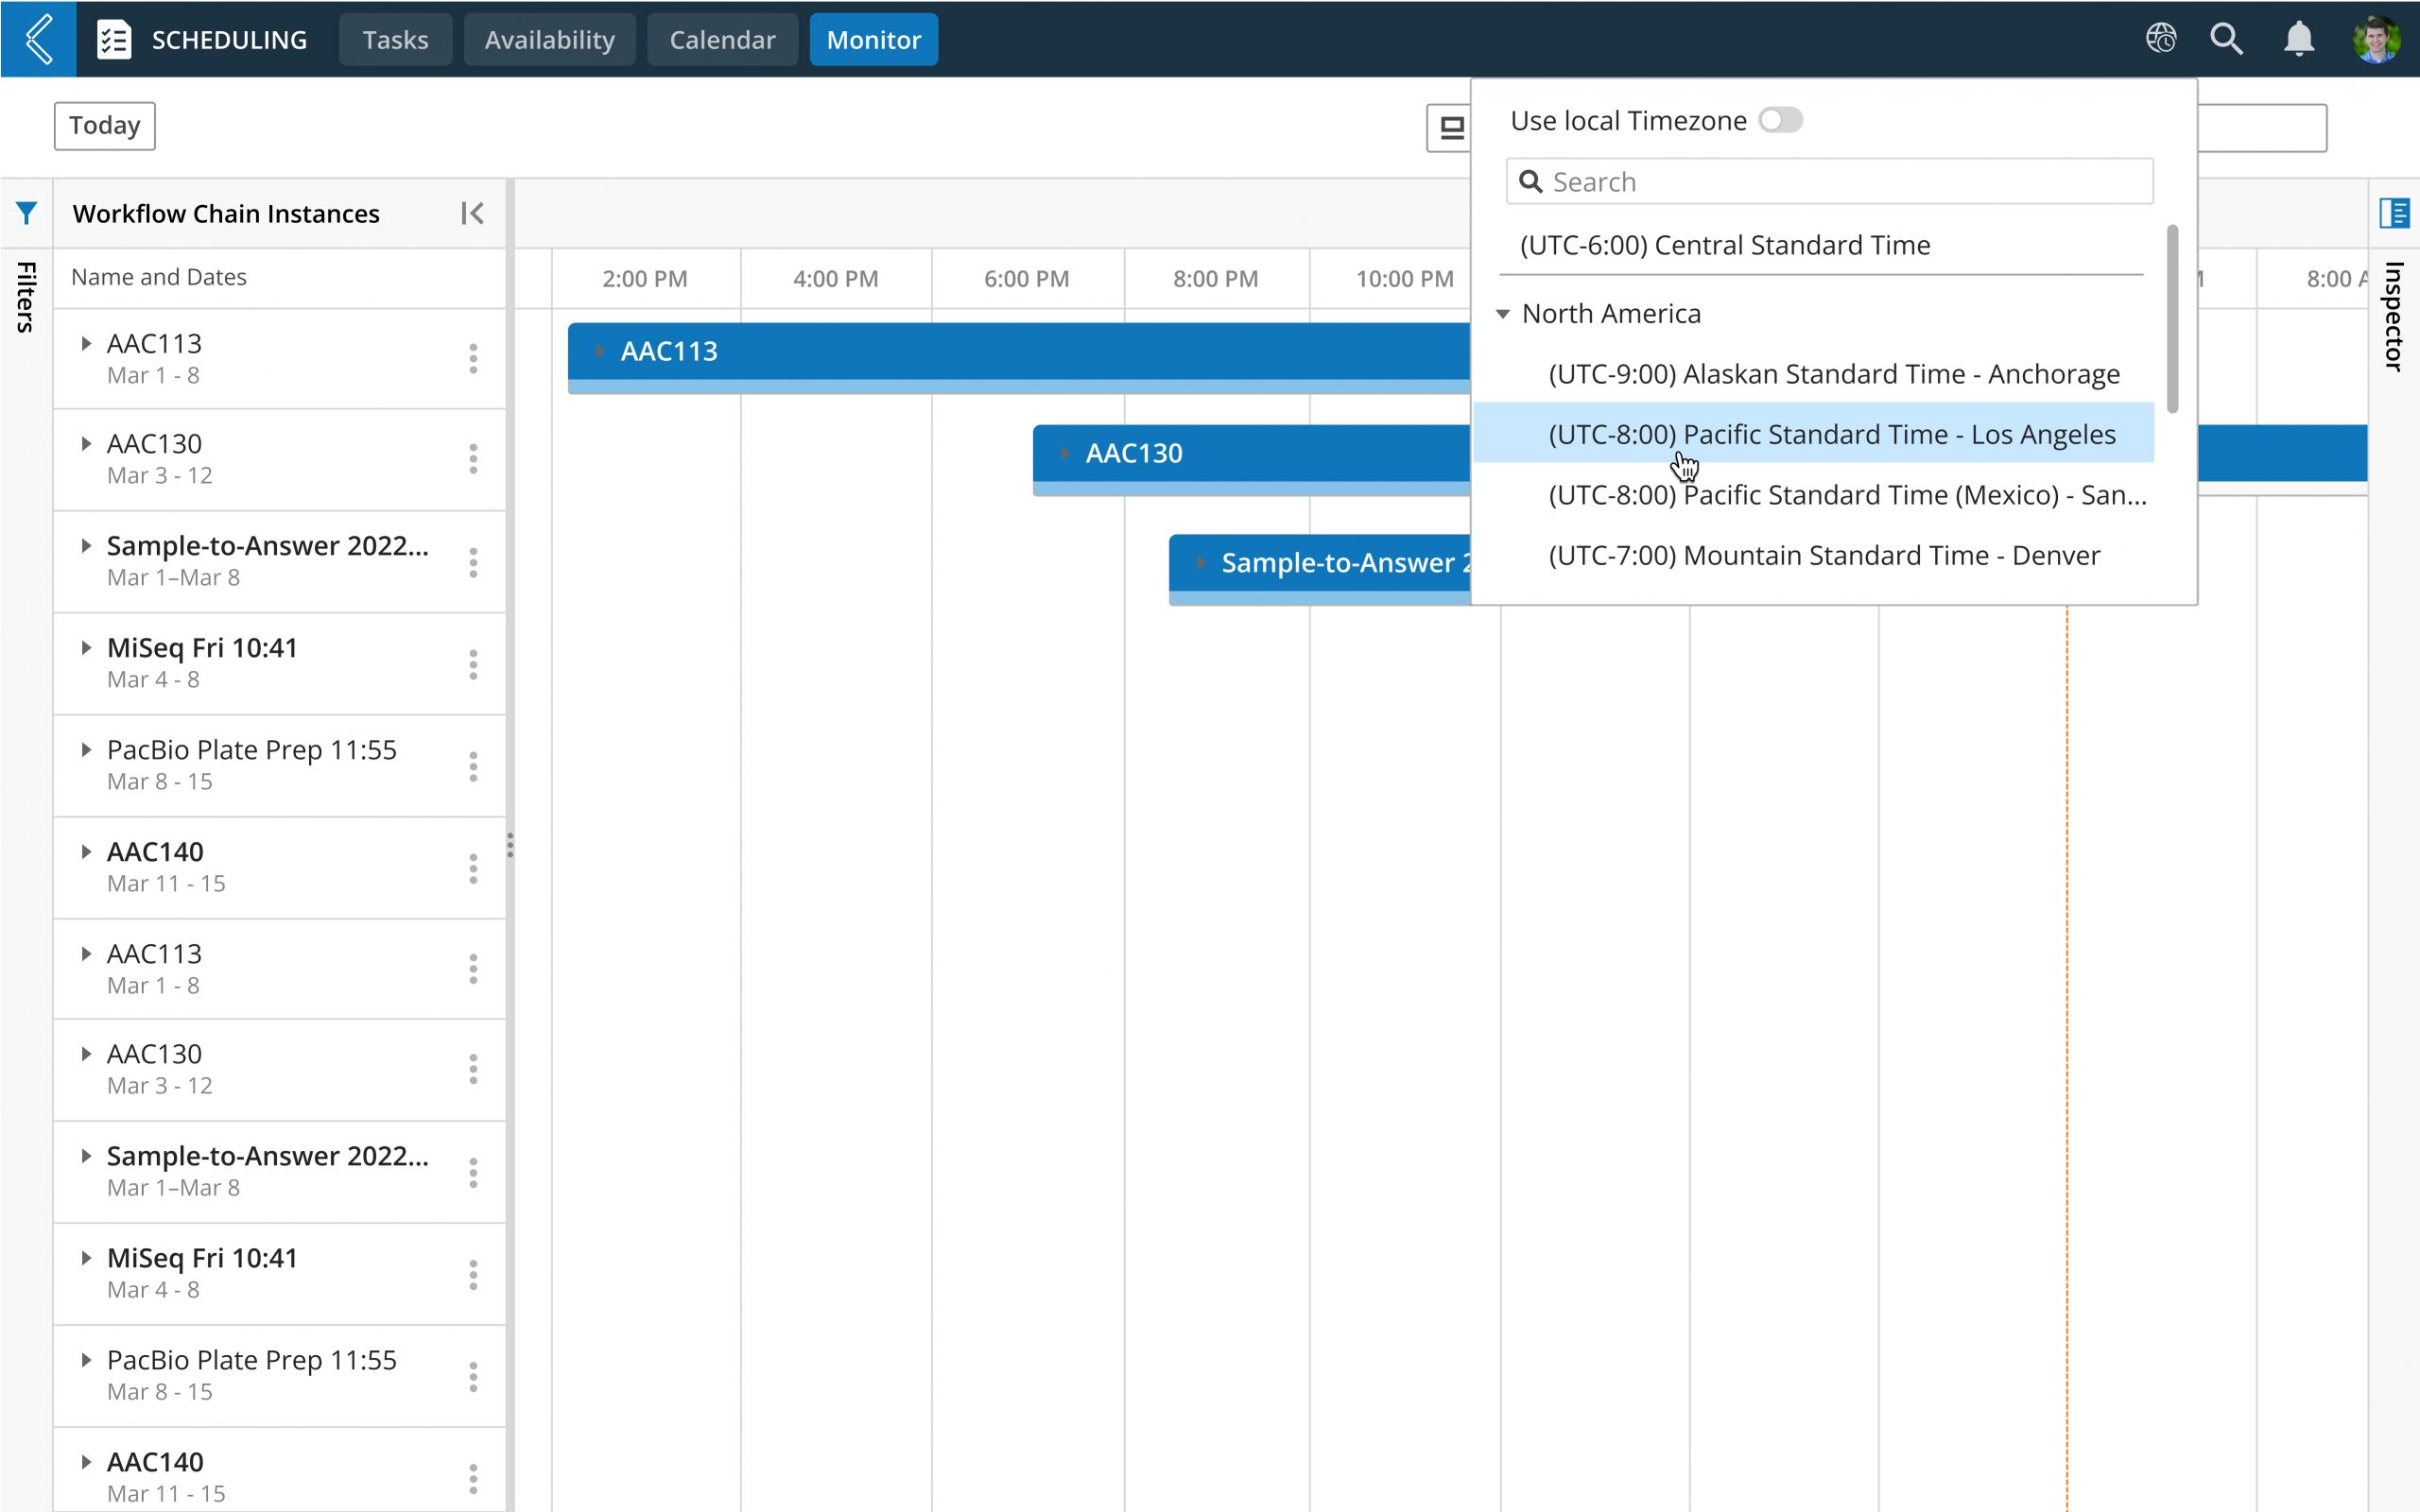
As a Lead UX/UI Designer, I focus on enhancing user experiences, increasing customer engagement, and optimizing product functionality to support users in tasks such as creating, scheduling, and conducting lab experiments, recording results, managing pharmaceutical manufacturing processes, and efficiently analyzing data.
My role involves building and maintaining a comprehensive design system and style guide, designing new features, and presenting ideas to improve the user experience using tools like Figma and Zeplin. I also conduct UI reviews with development teams and facilitate user interviews to ensure alignment between design and user needs.
I collaborate closely with the product owner, team leads, and subject matter experts (SMEs) to design and hand off assets to the development team, ensuring that designs are implemented accurately. Given that this platform includes multiple applications, I ensure consistency across the entire system and work with developers to uphold established design standards and guidelines.
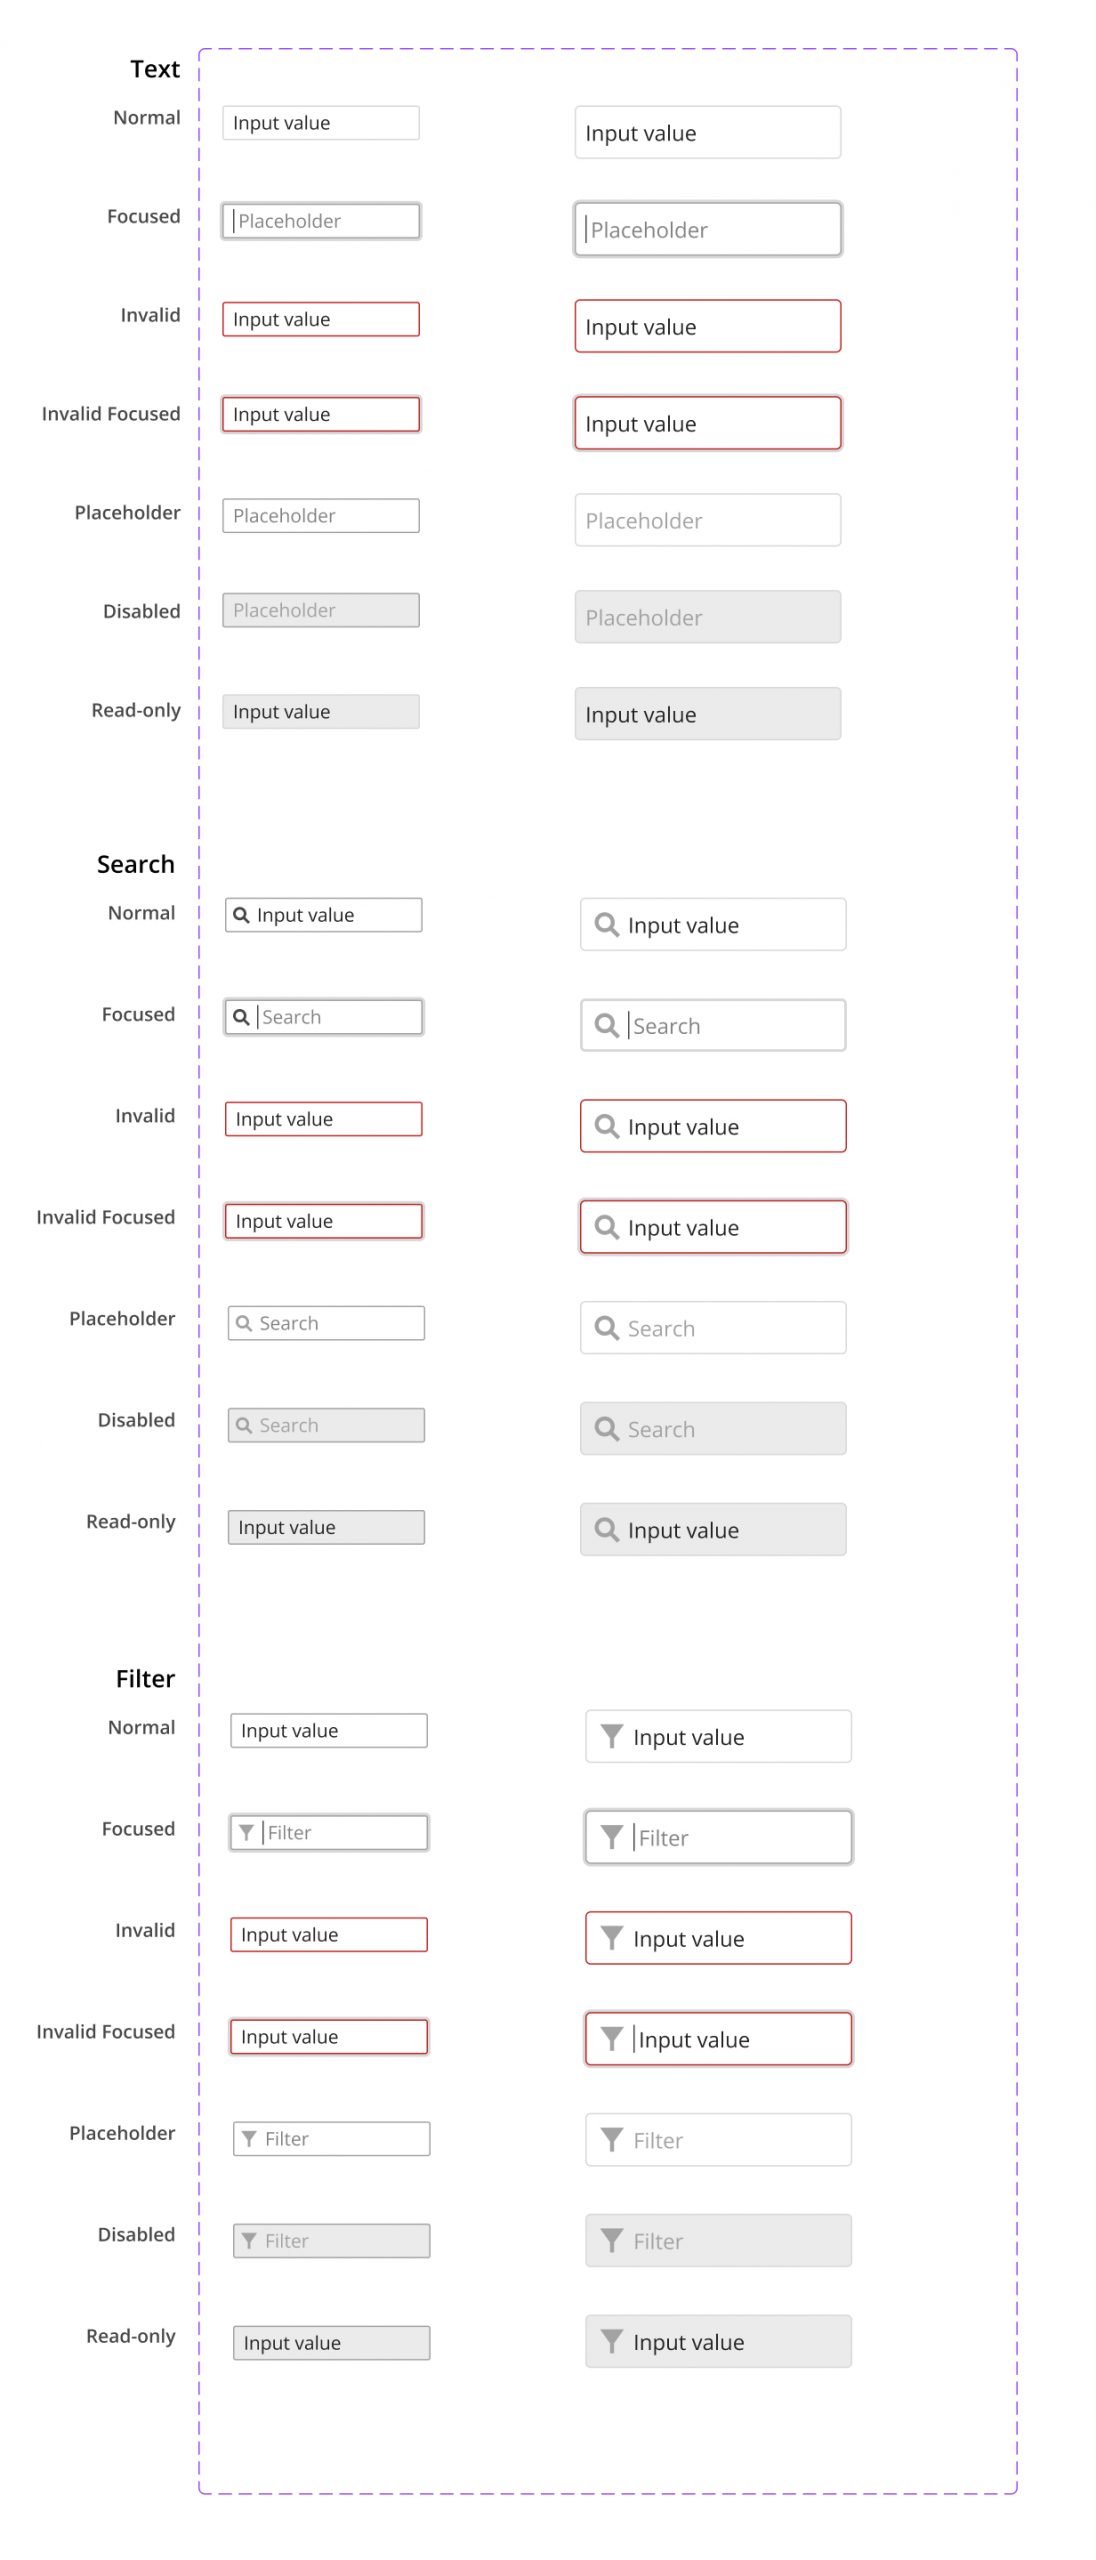
DESIGN SYSTEM
– System synched with Code
Having a good Design System is where fast, consistent and scalable development starts.
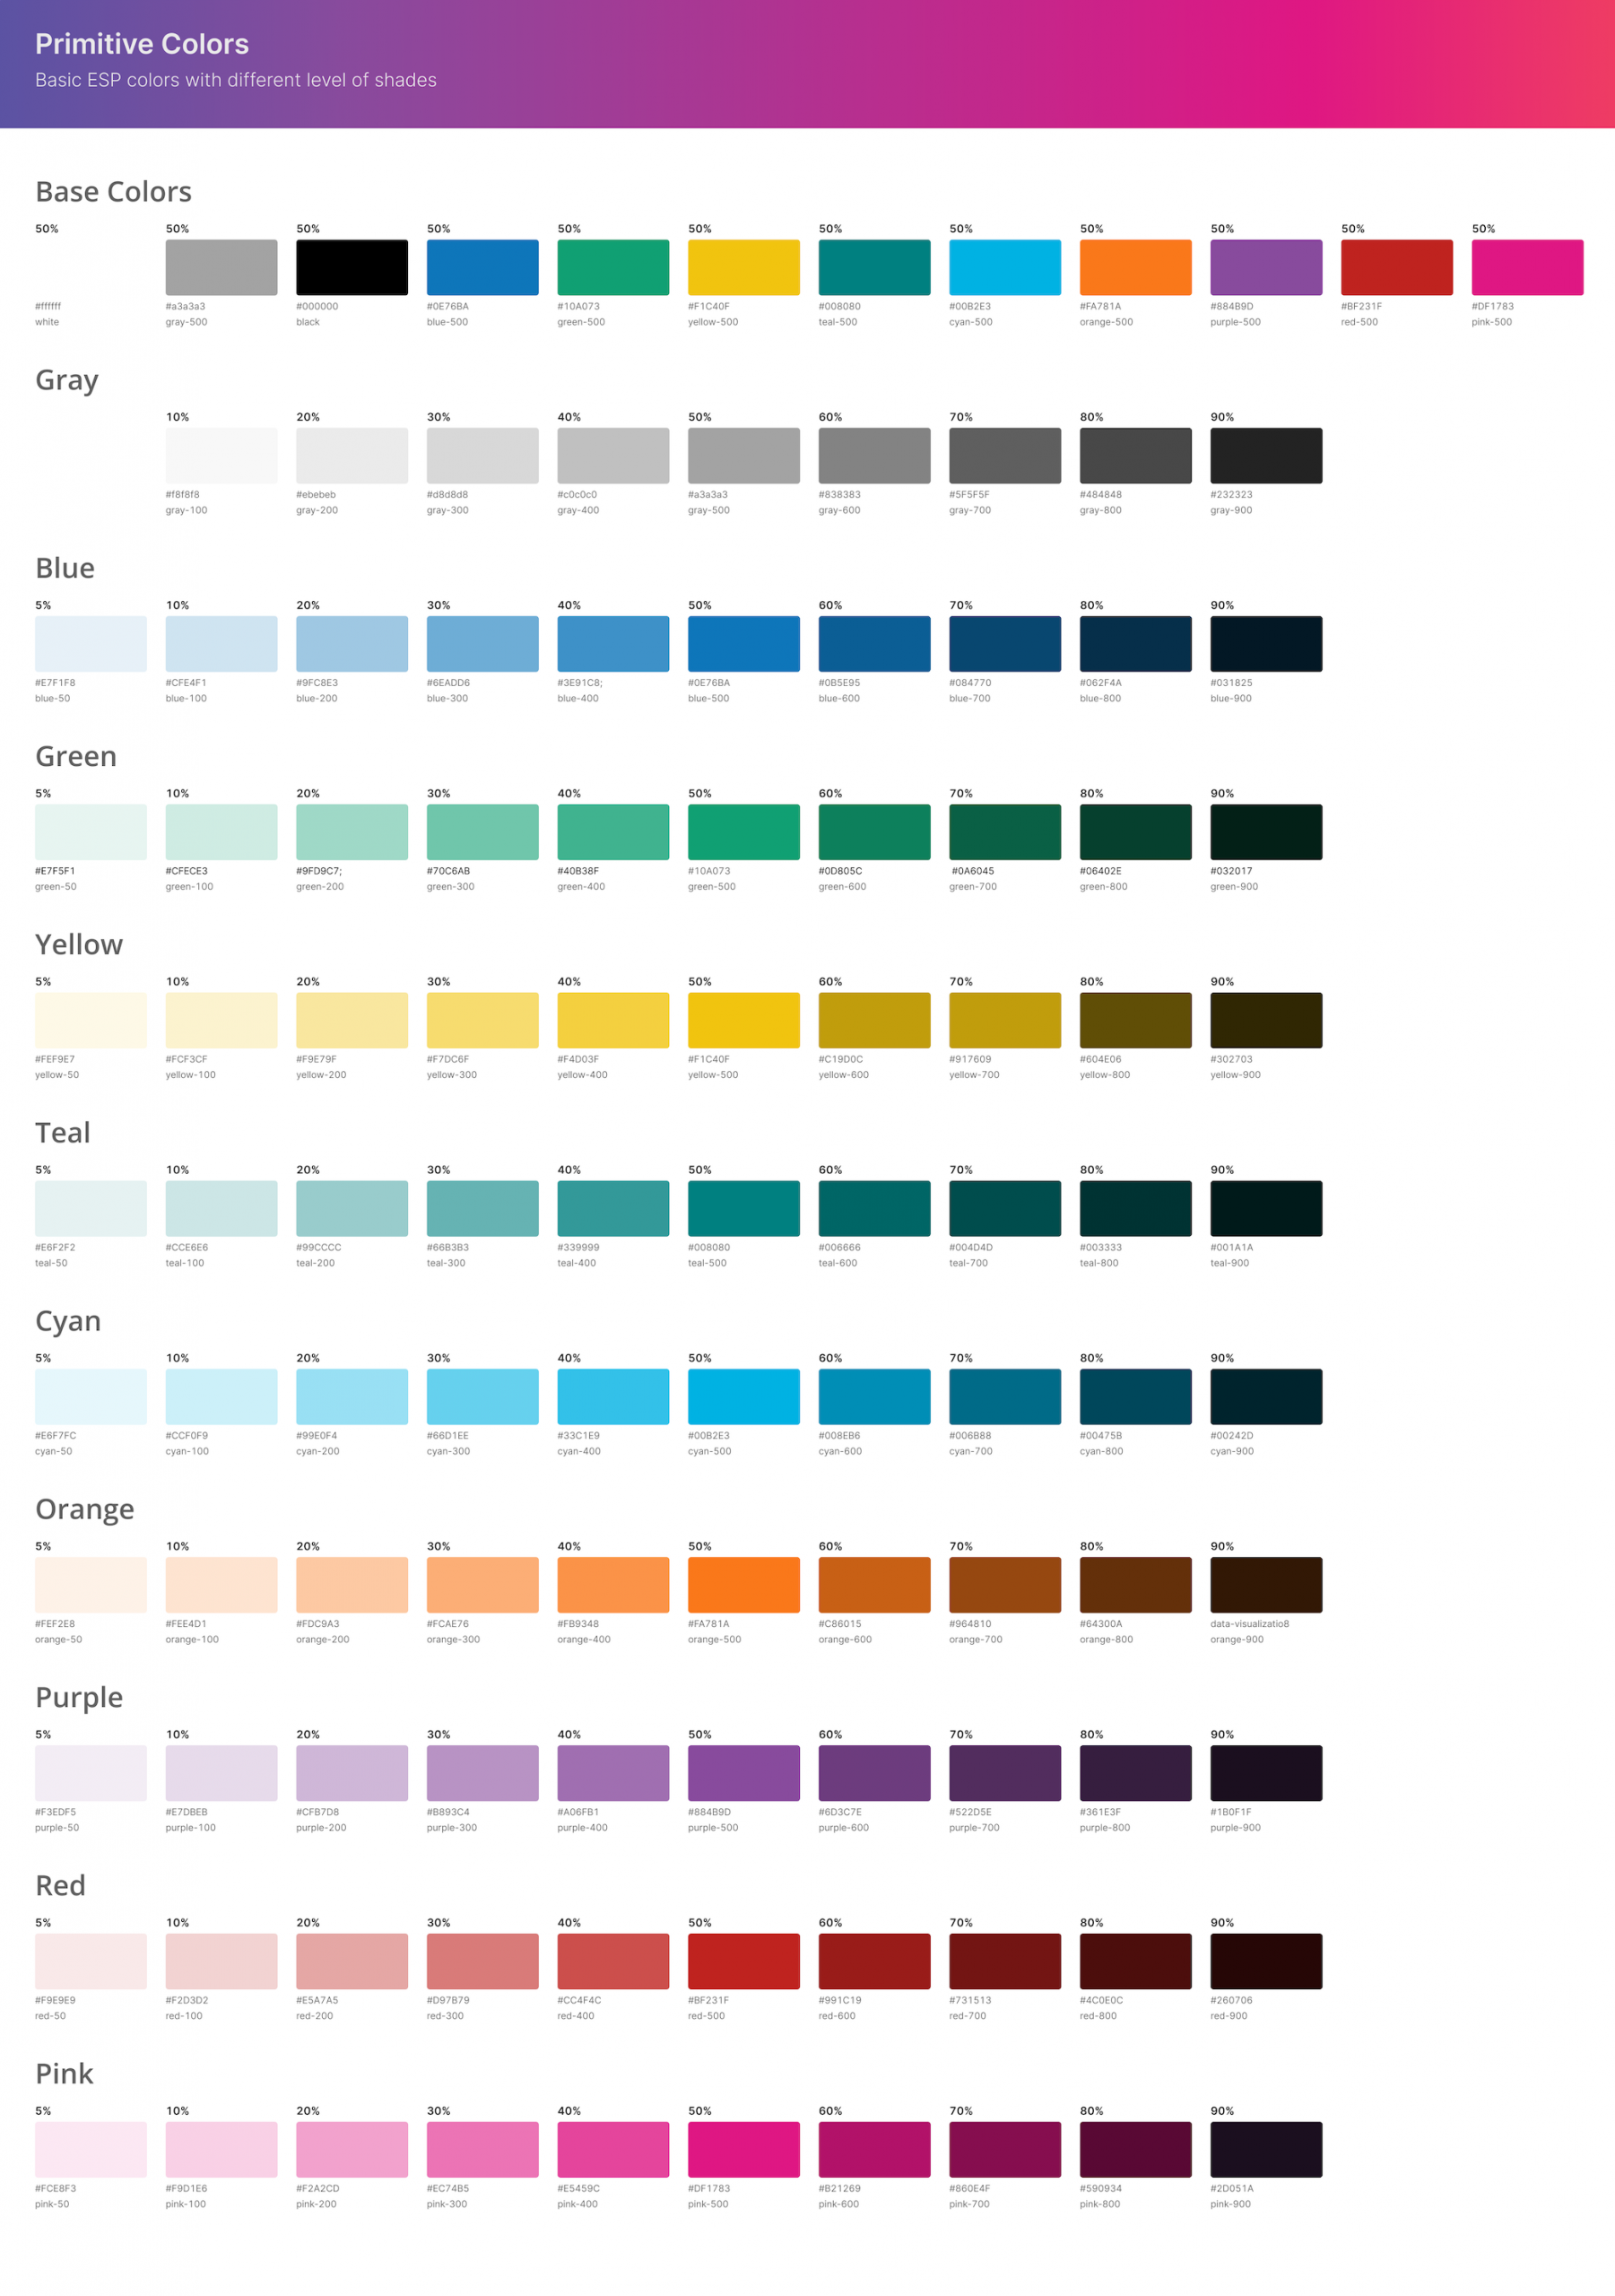
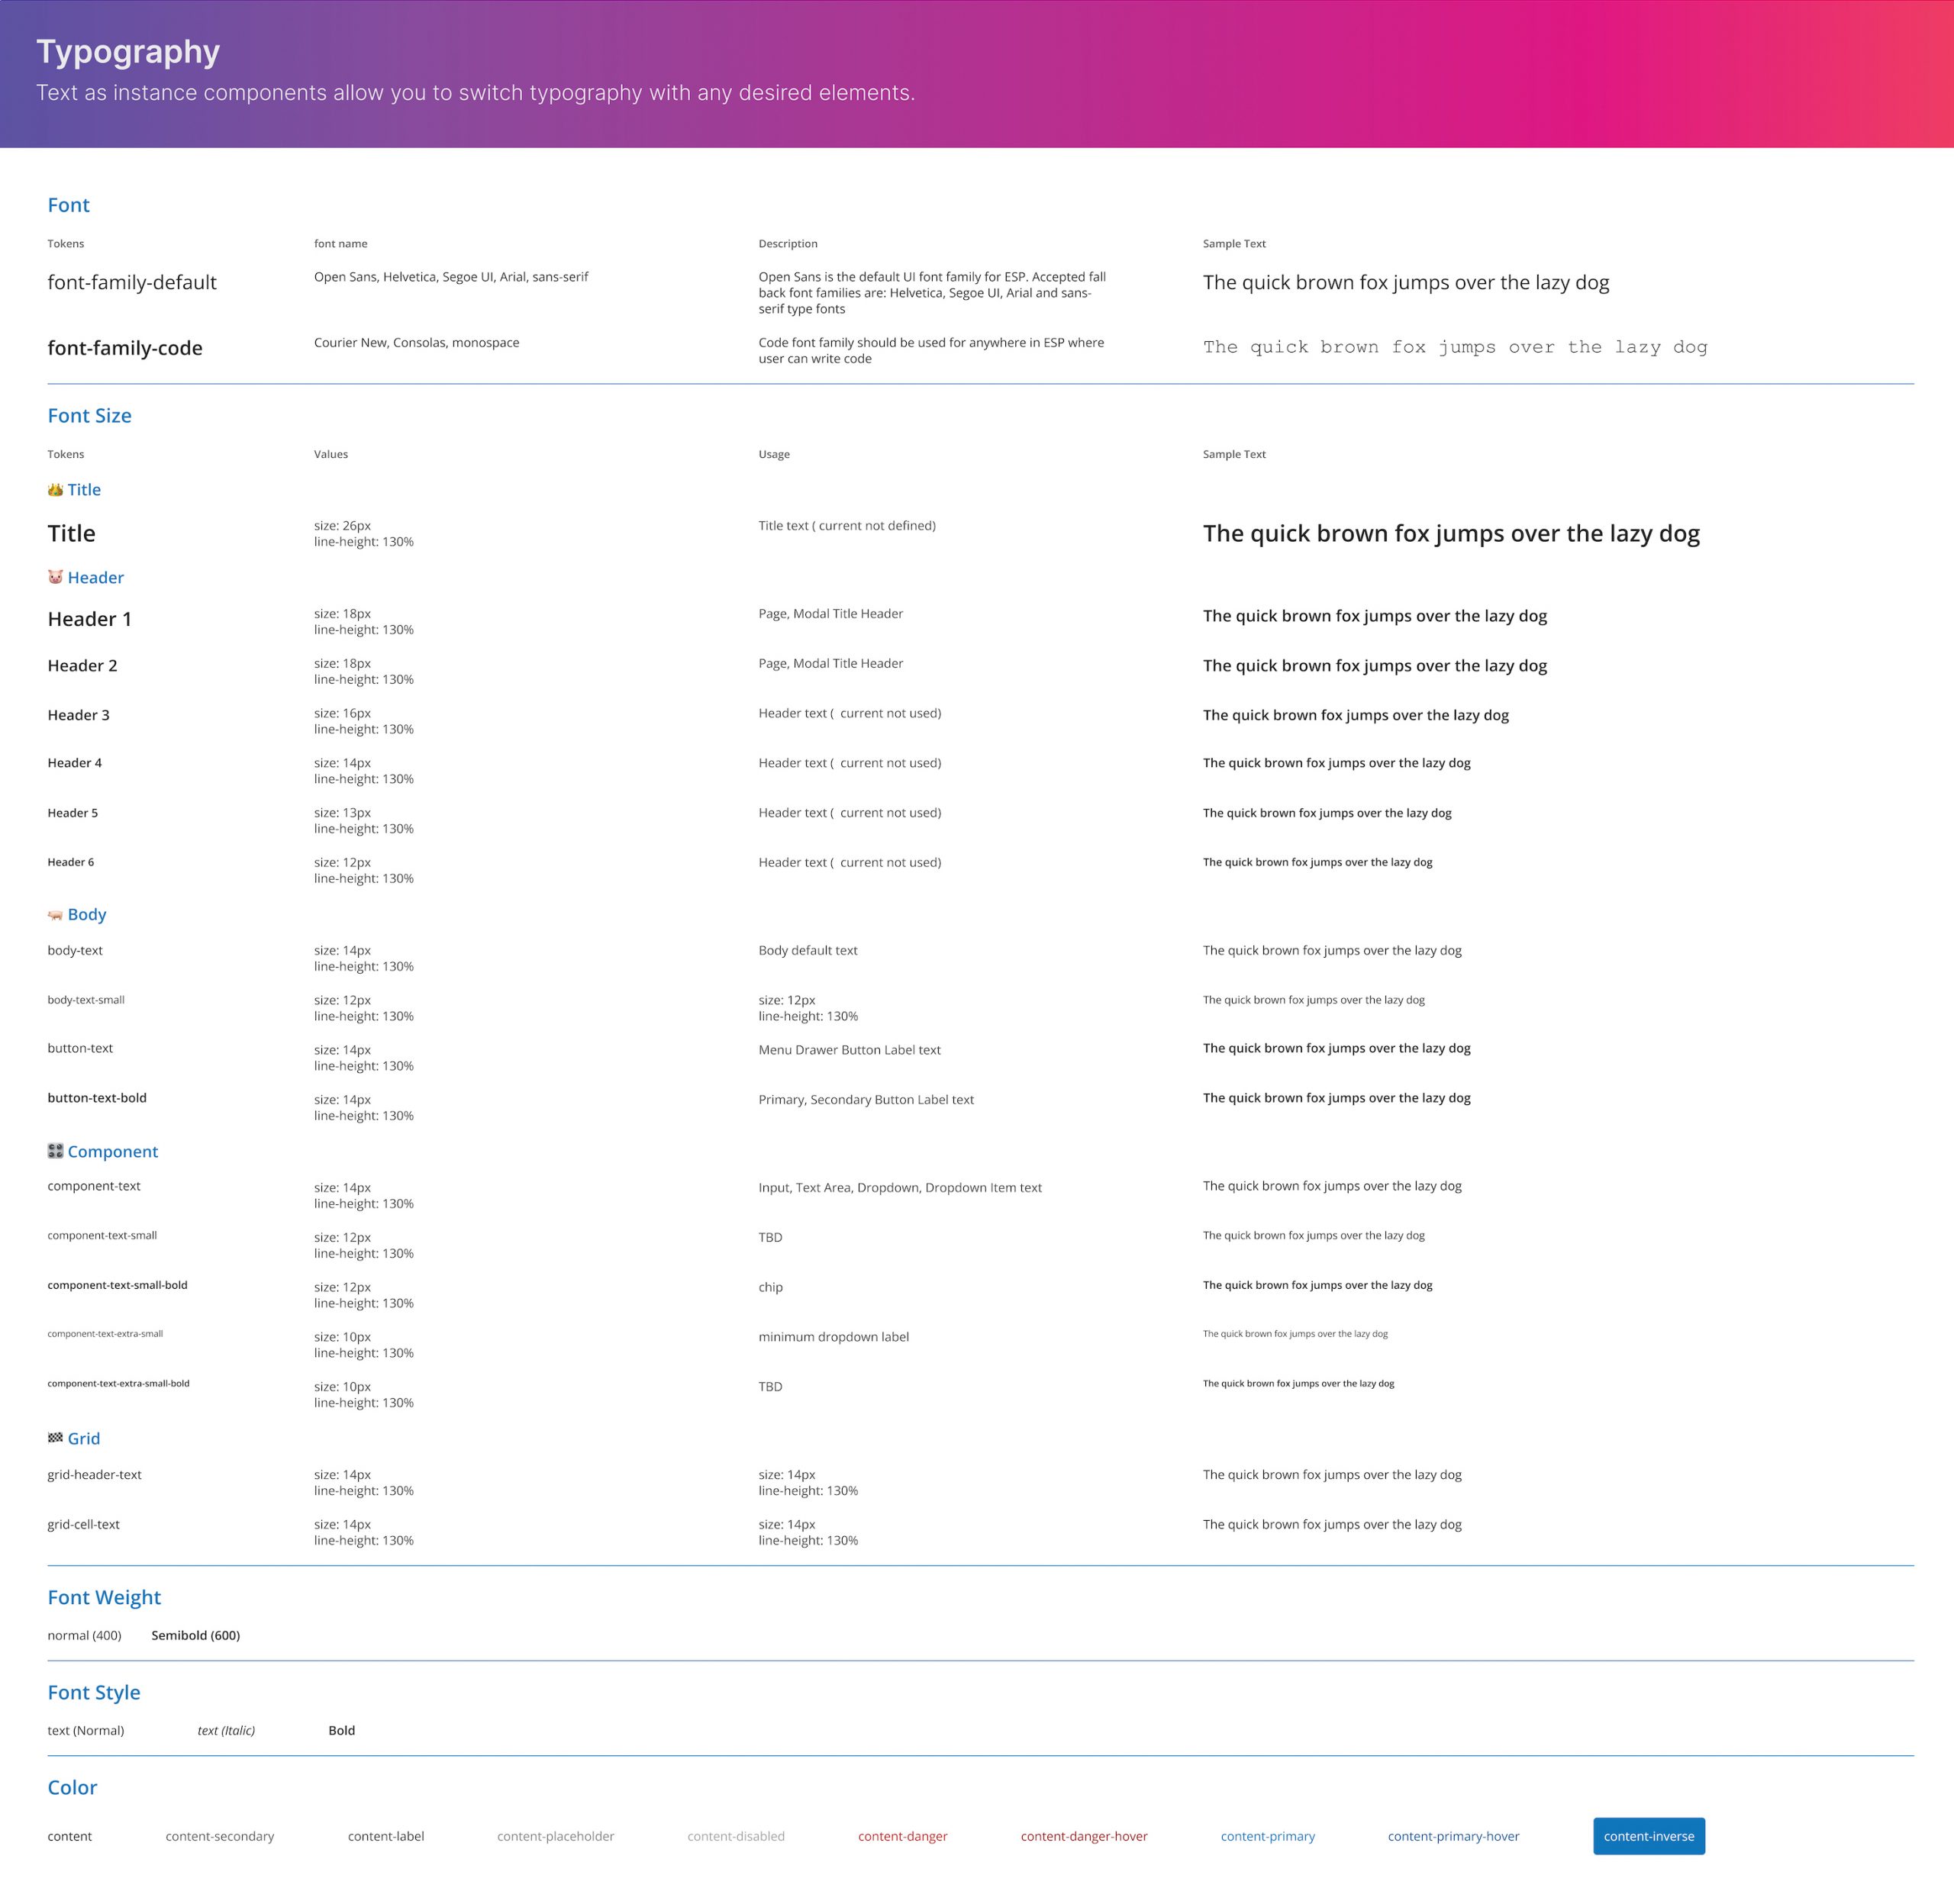
The new Design System I created uses Design Tokens that match with variables in SCSS in the existing code base and is Storybook ready.
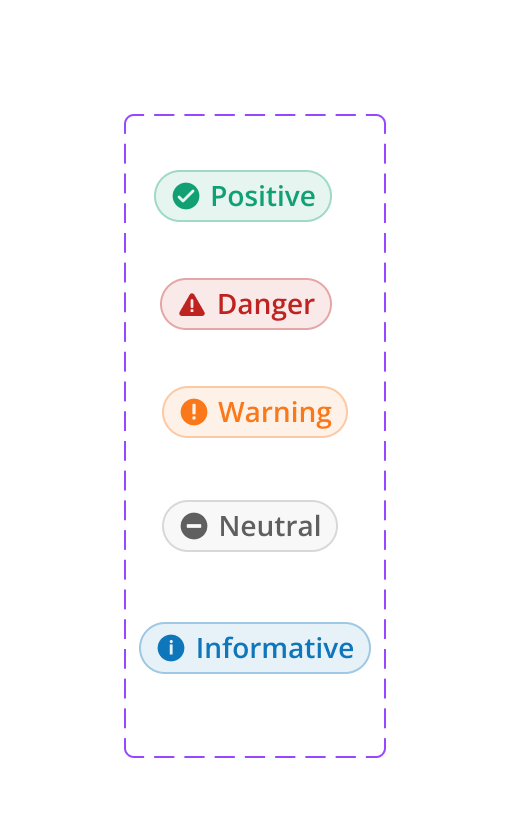
With a consistent, well-designed component library, users enjoy a more intuitive and seamless experience across the product.
Also with this new design system, any updates including changes to the color palettes or typography can be done in one place. This makes it easier for white labeling the product or developer to reference and apply the new updates.
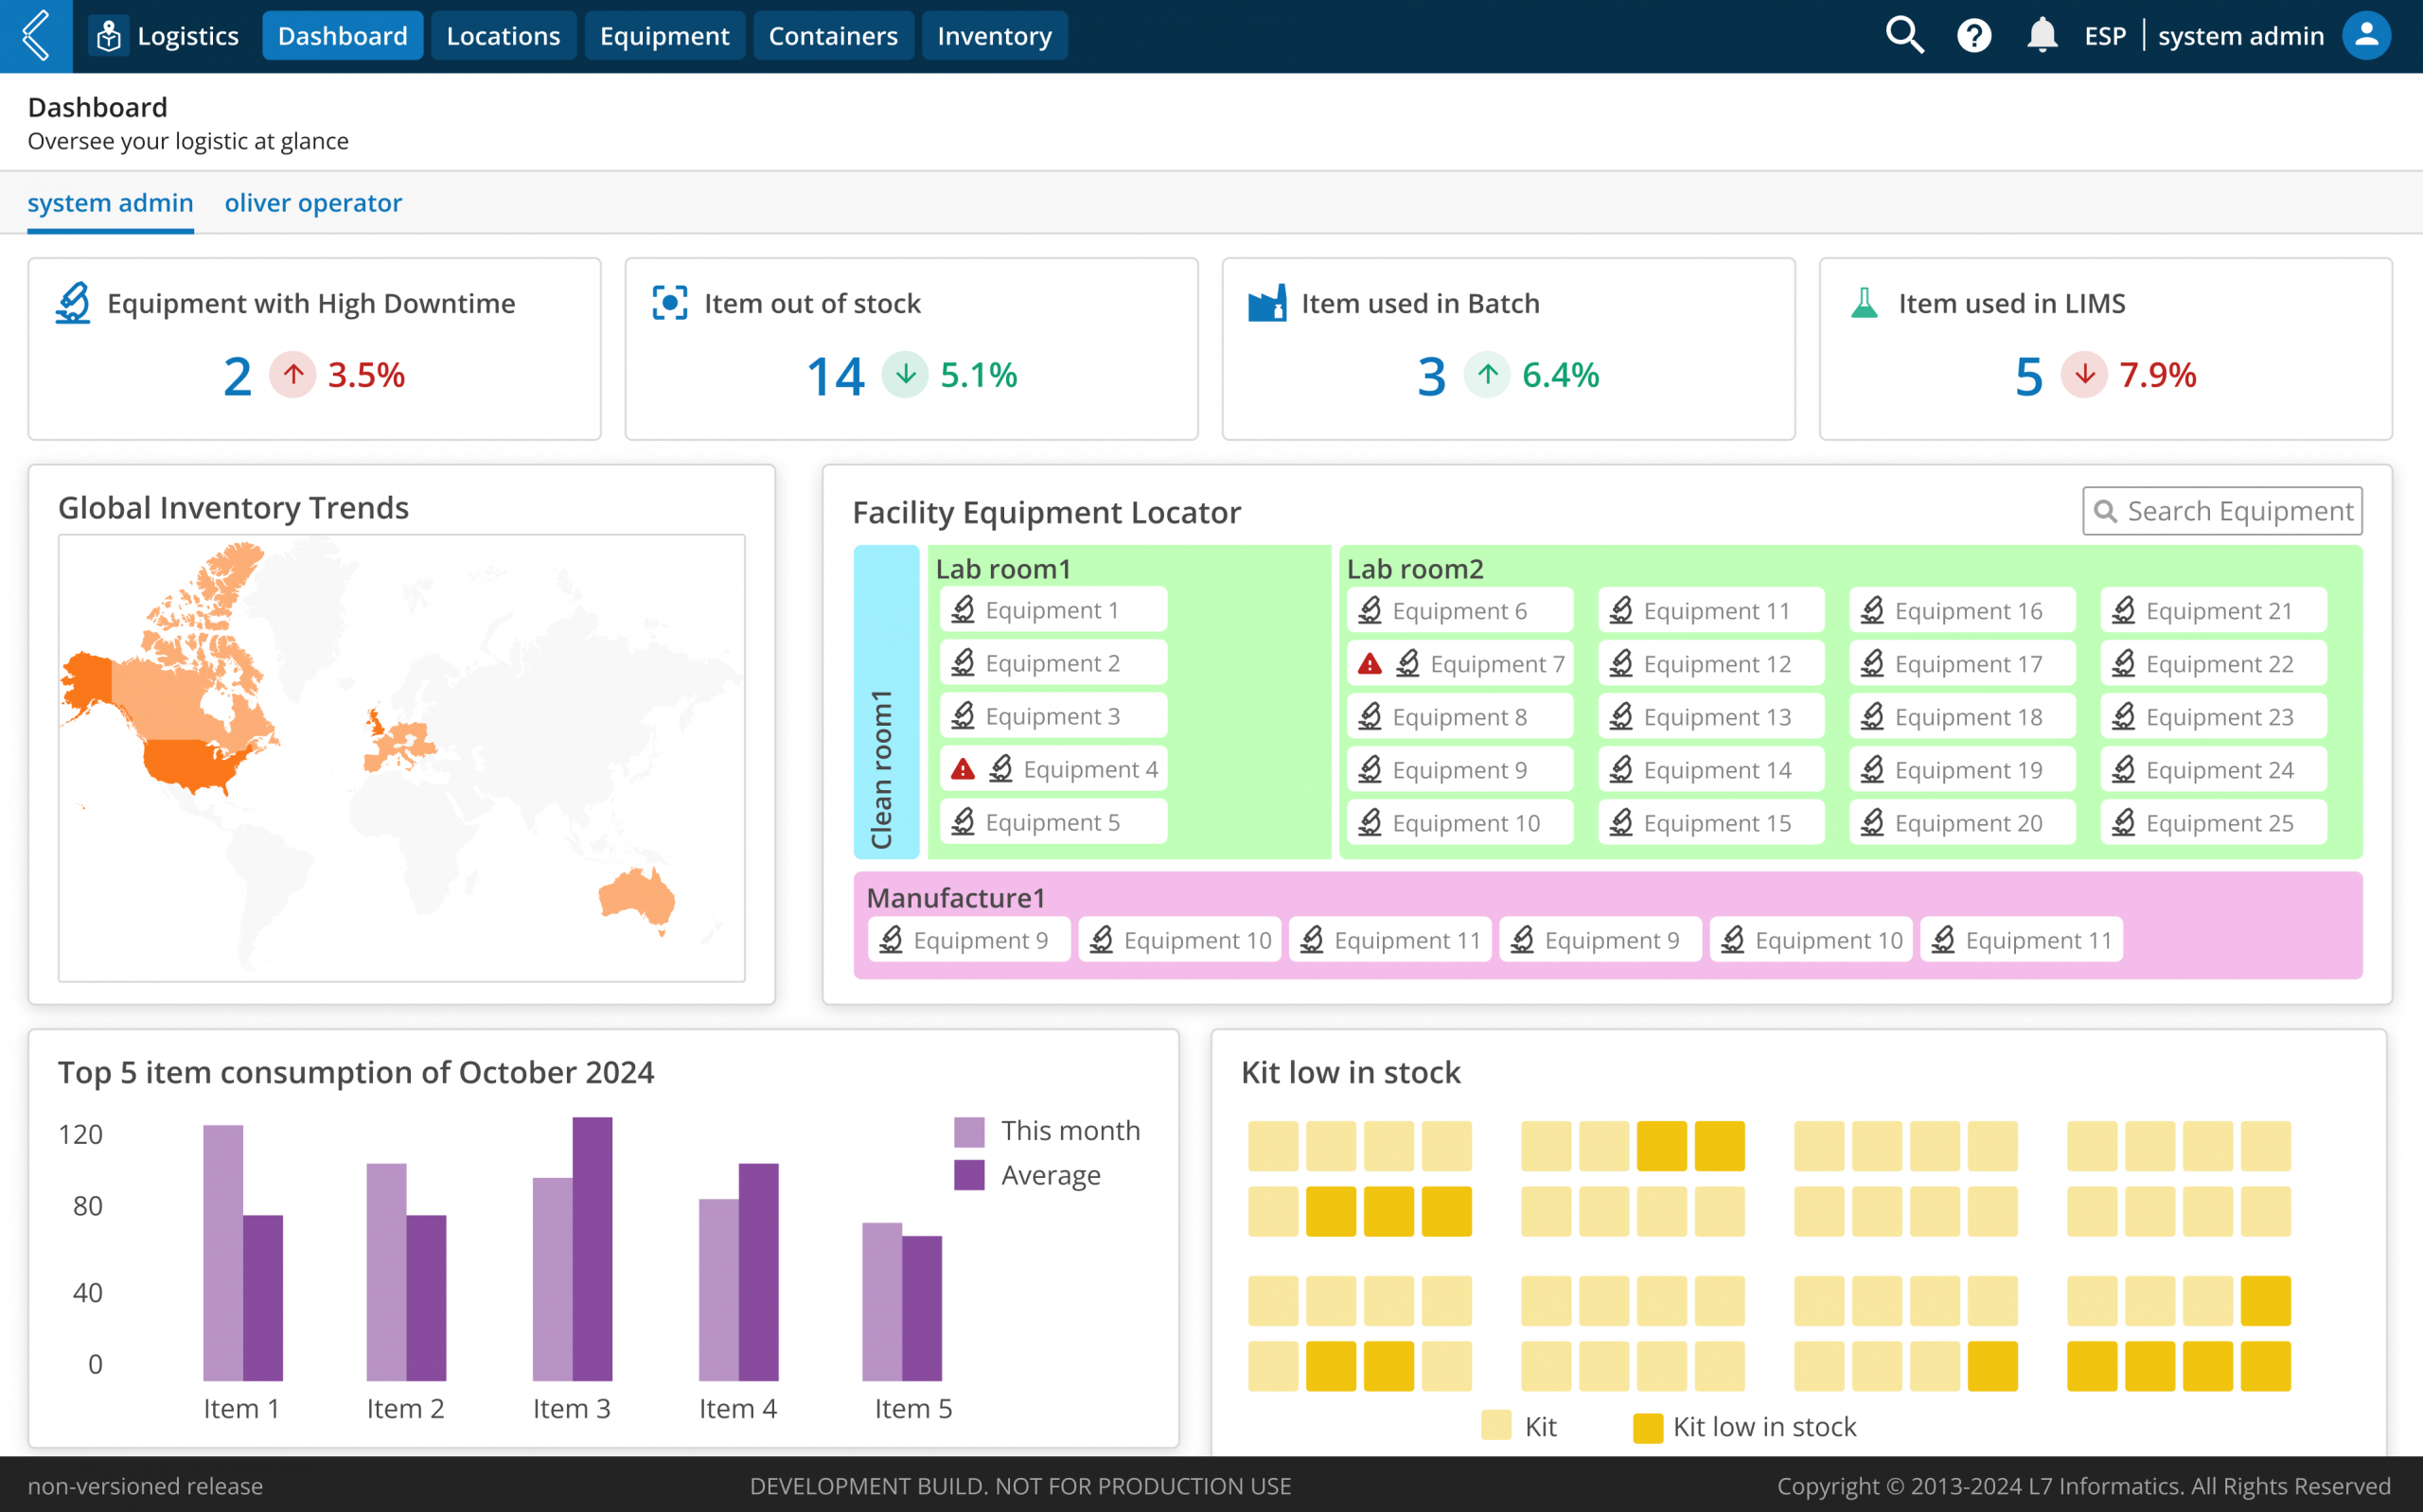
DASHBOARD DESIGN
– A Storytelling Dashboard That Speaks Through Data
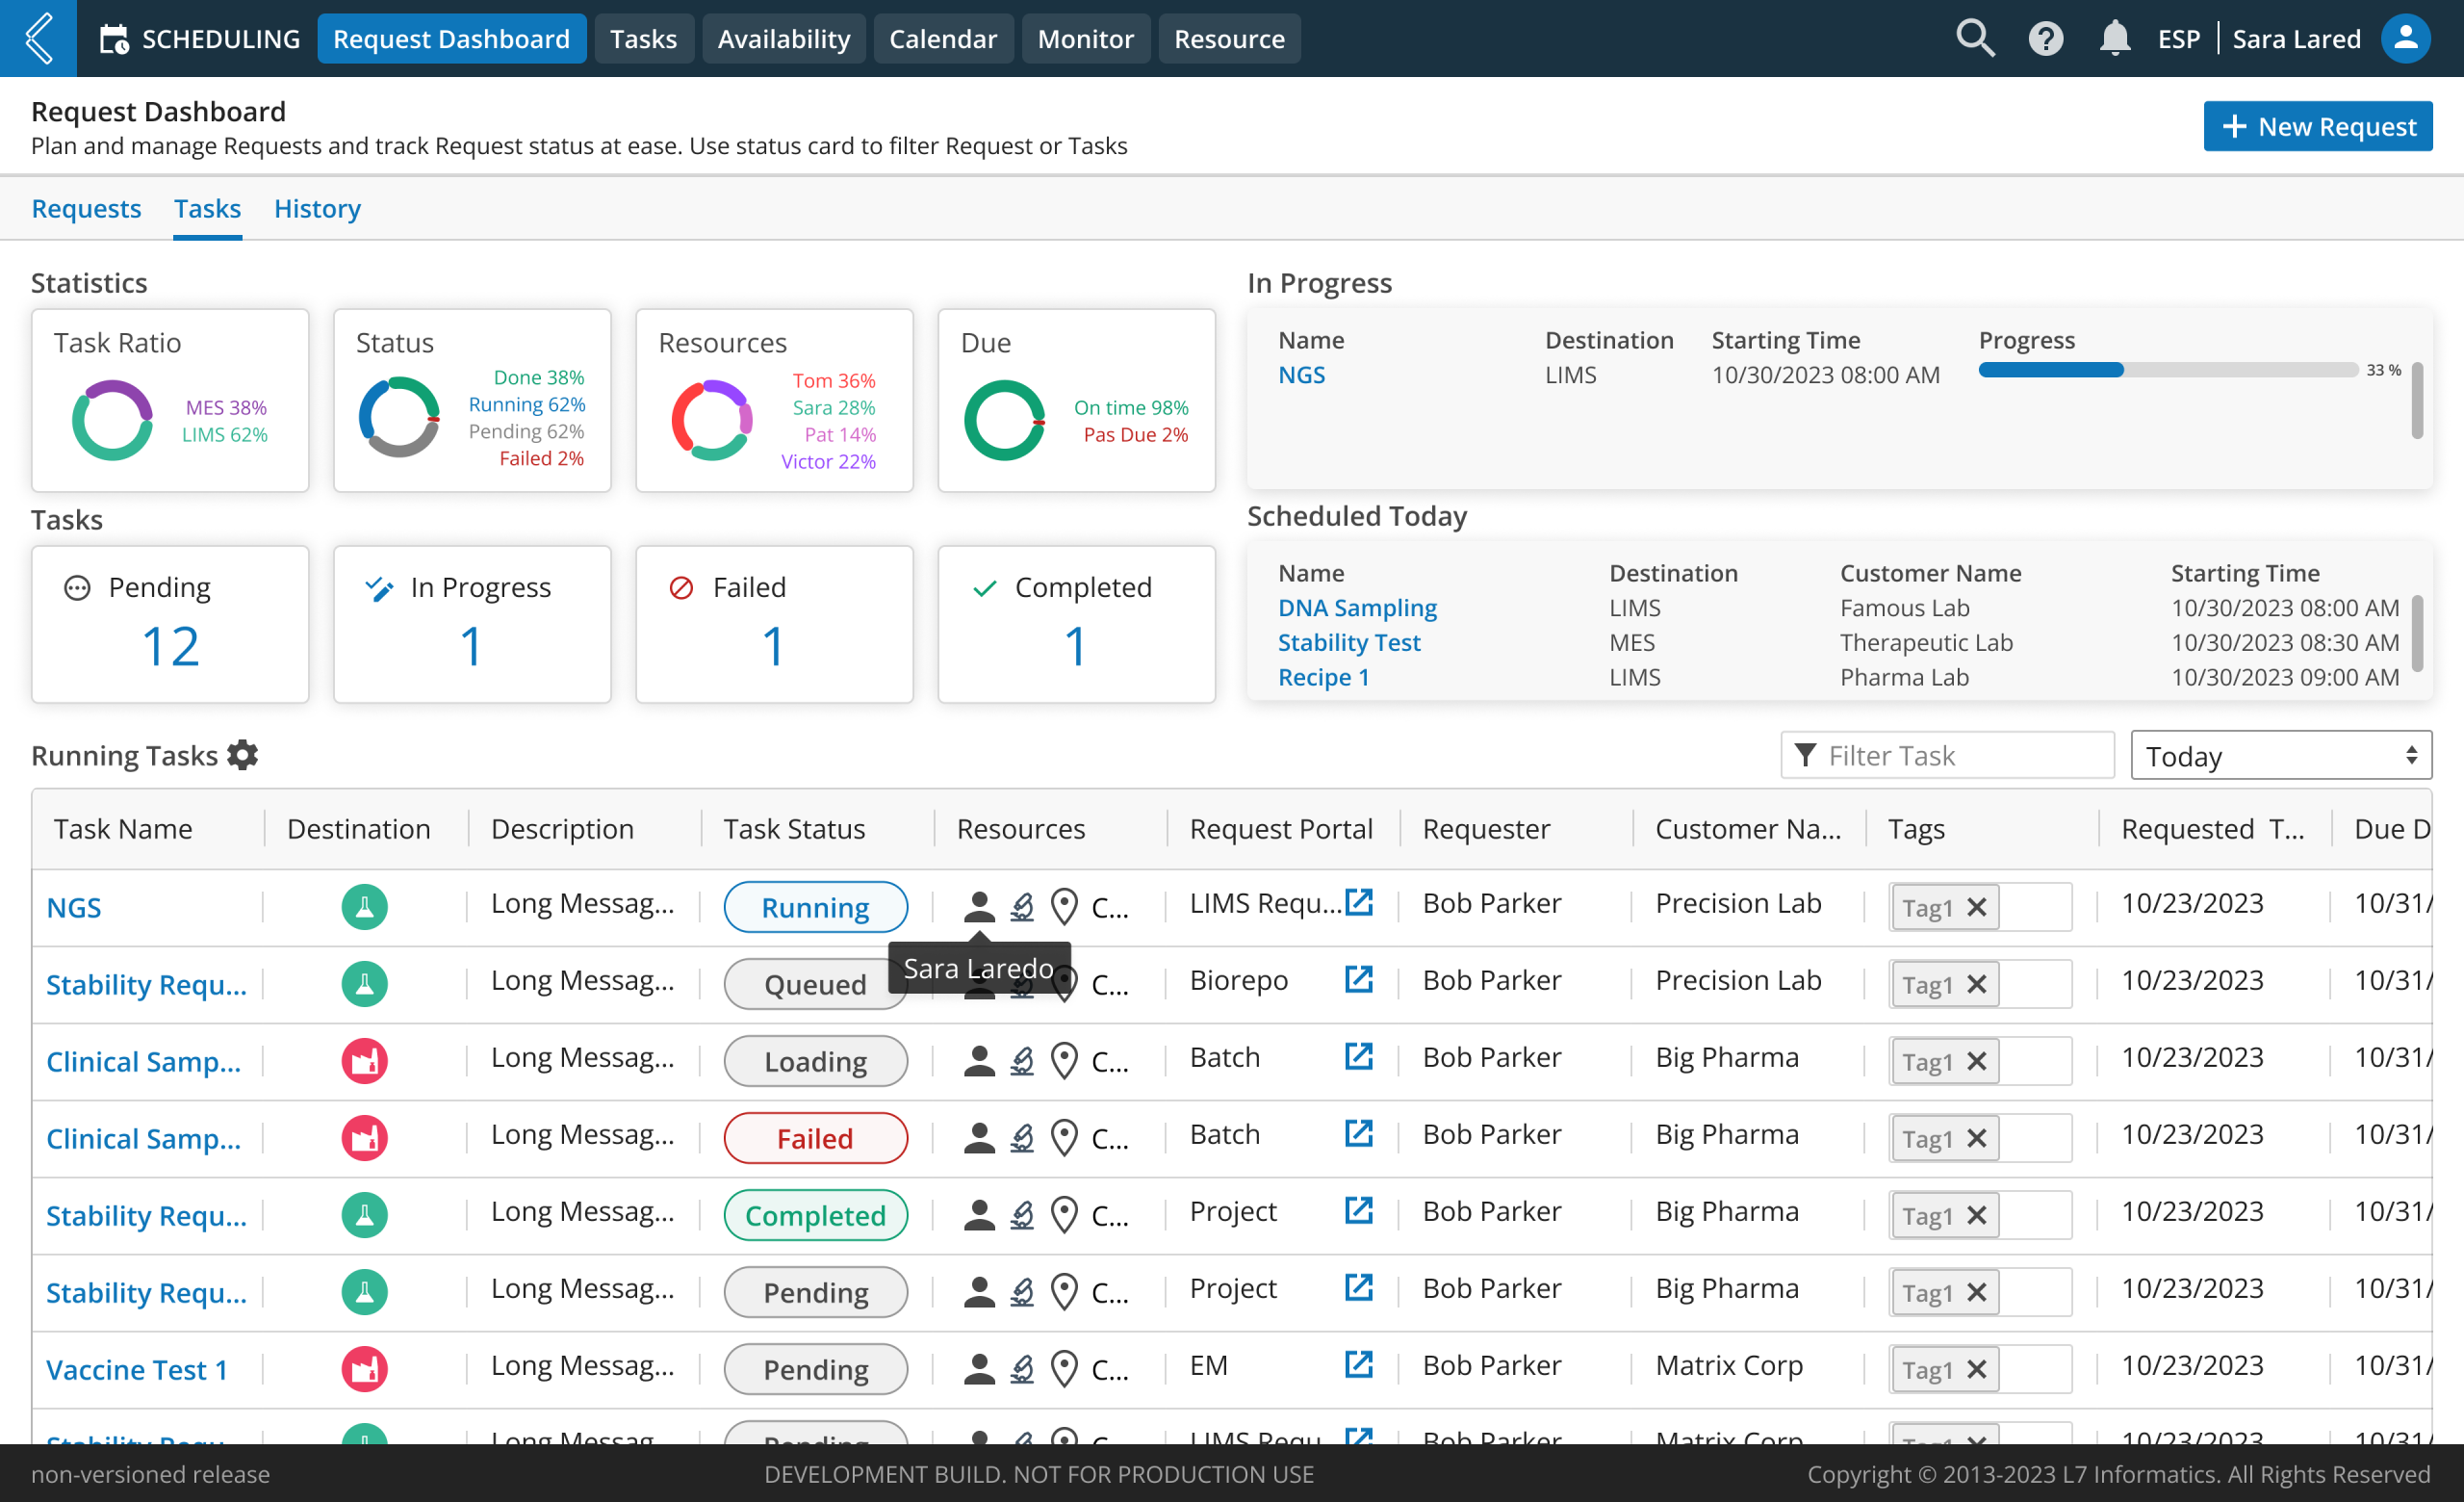
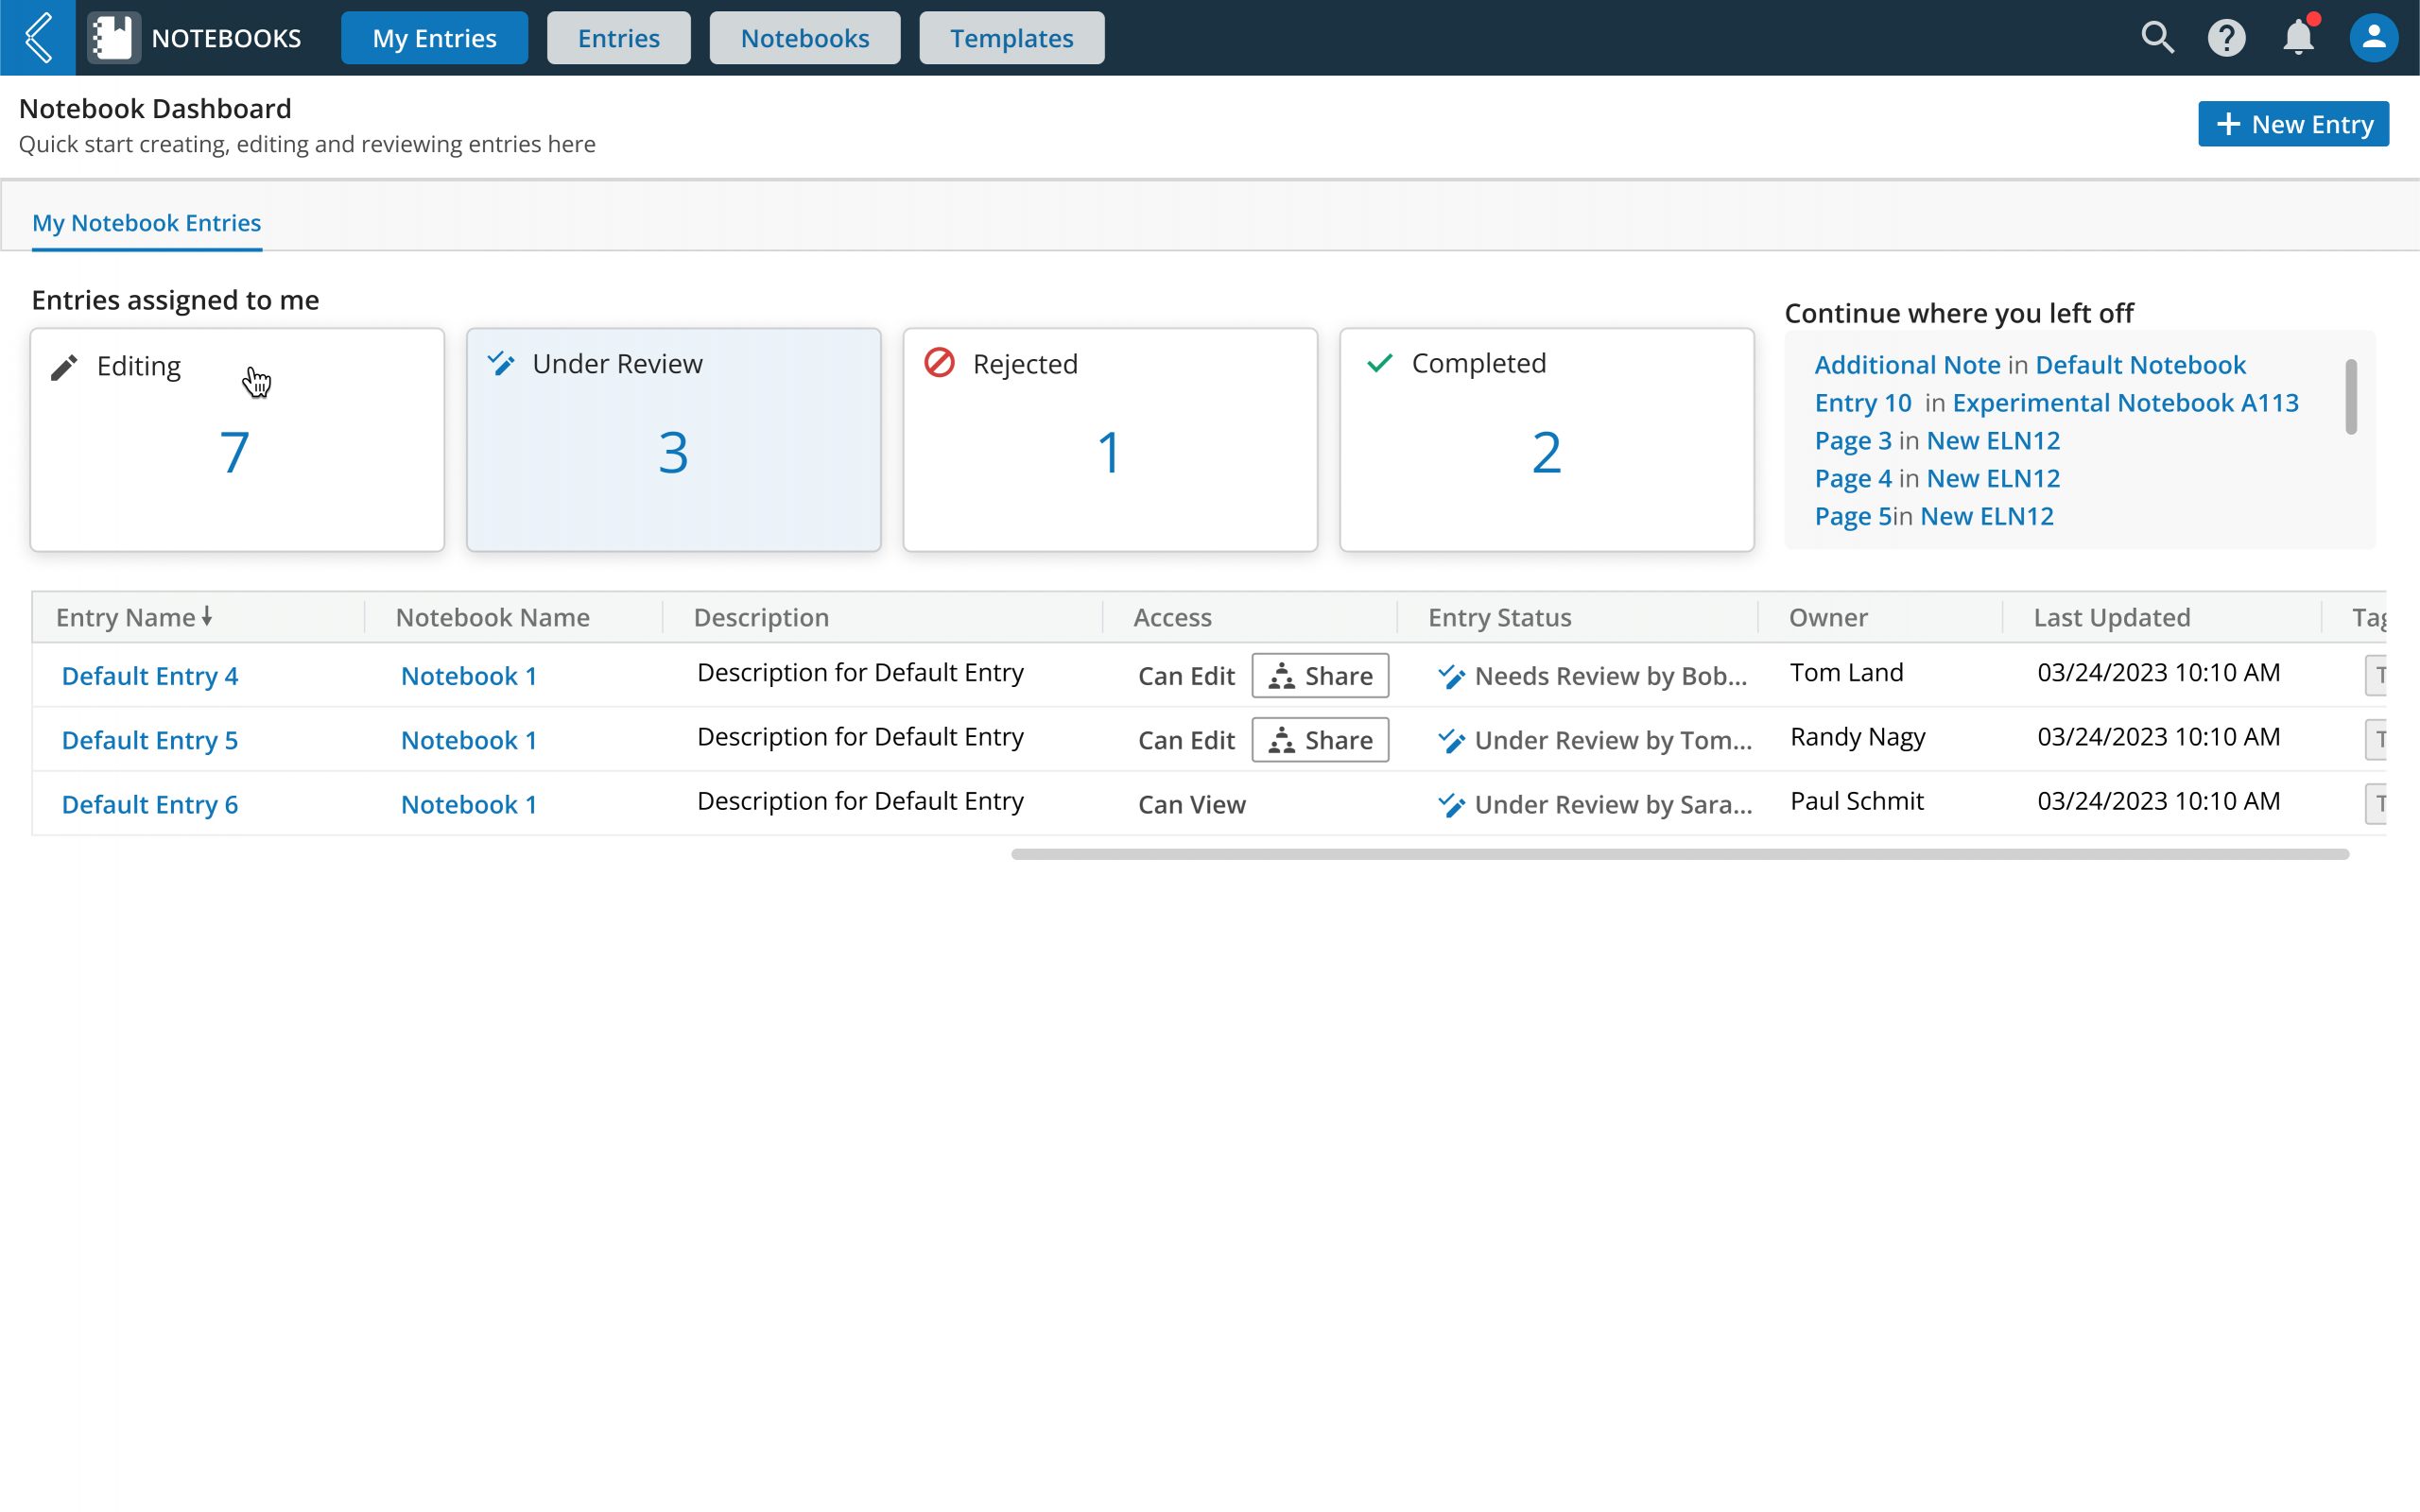
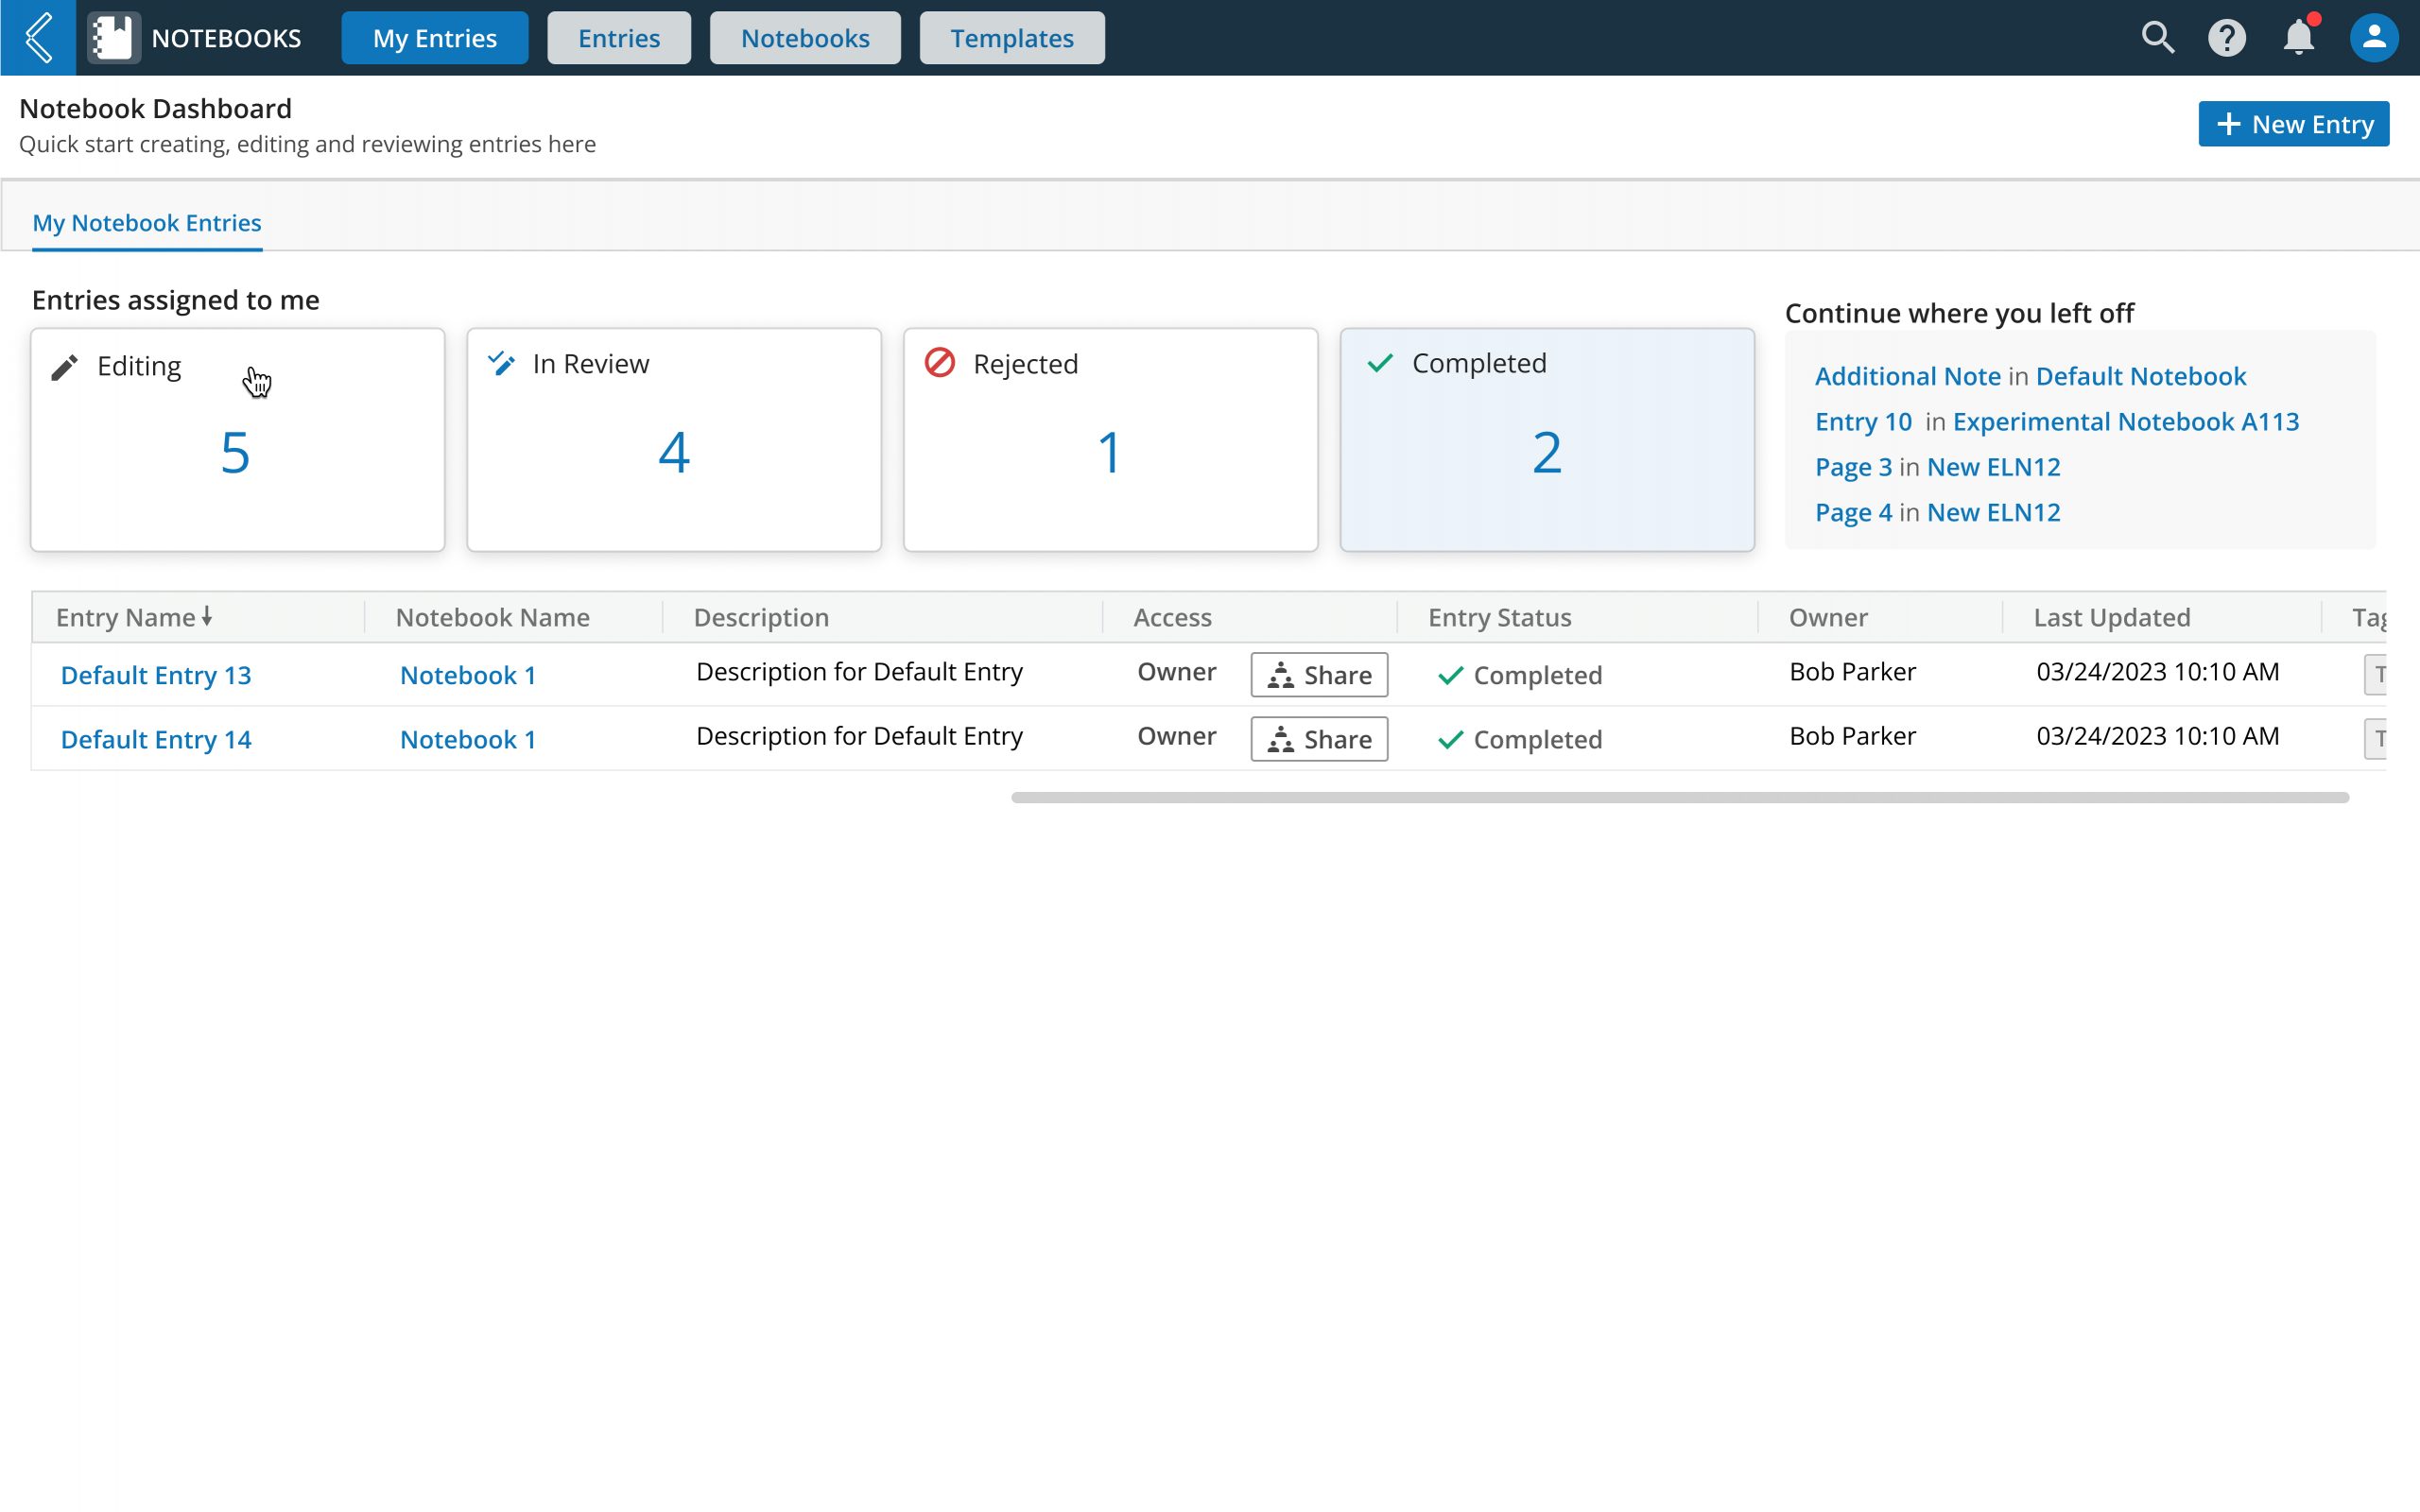
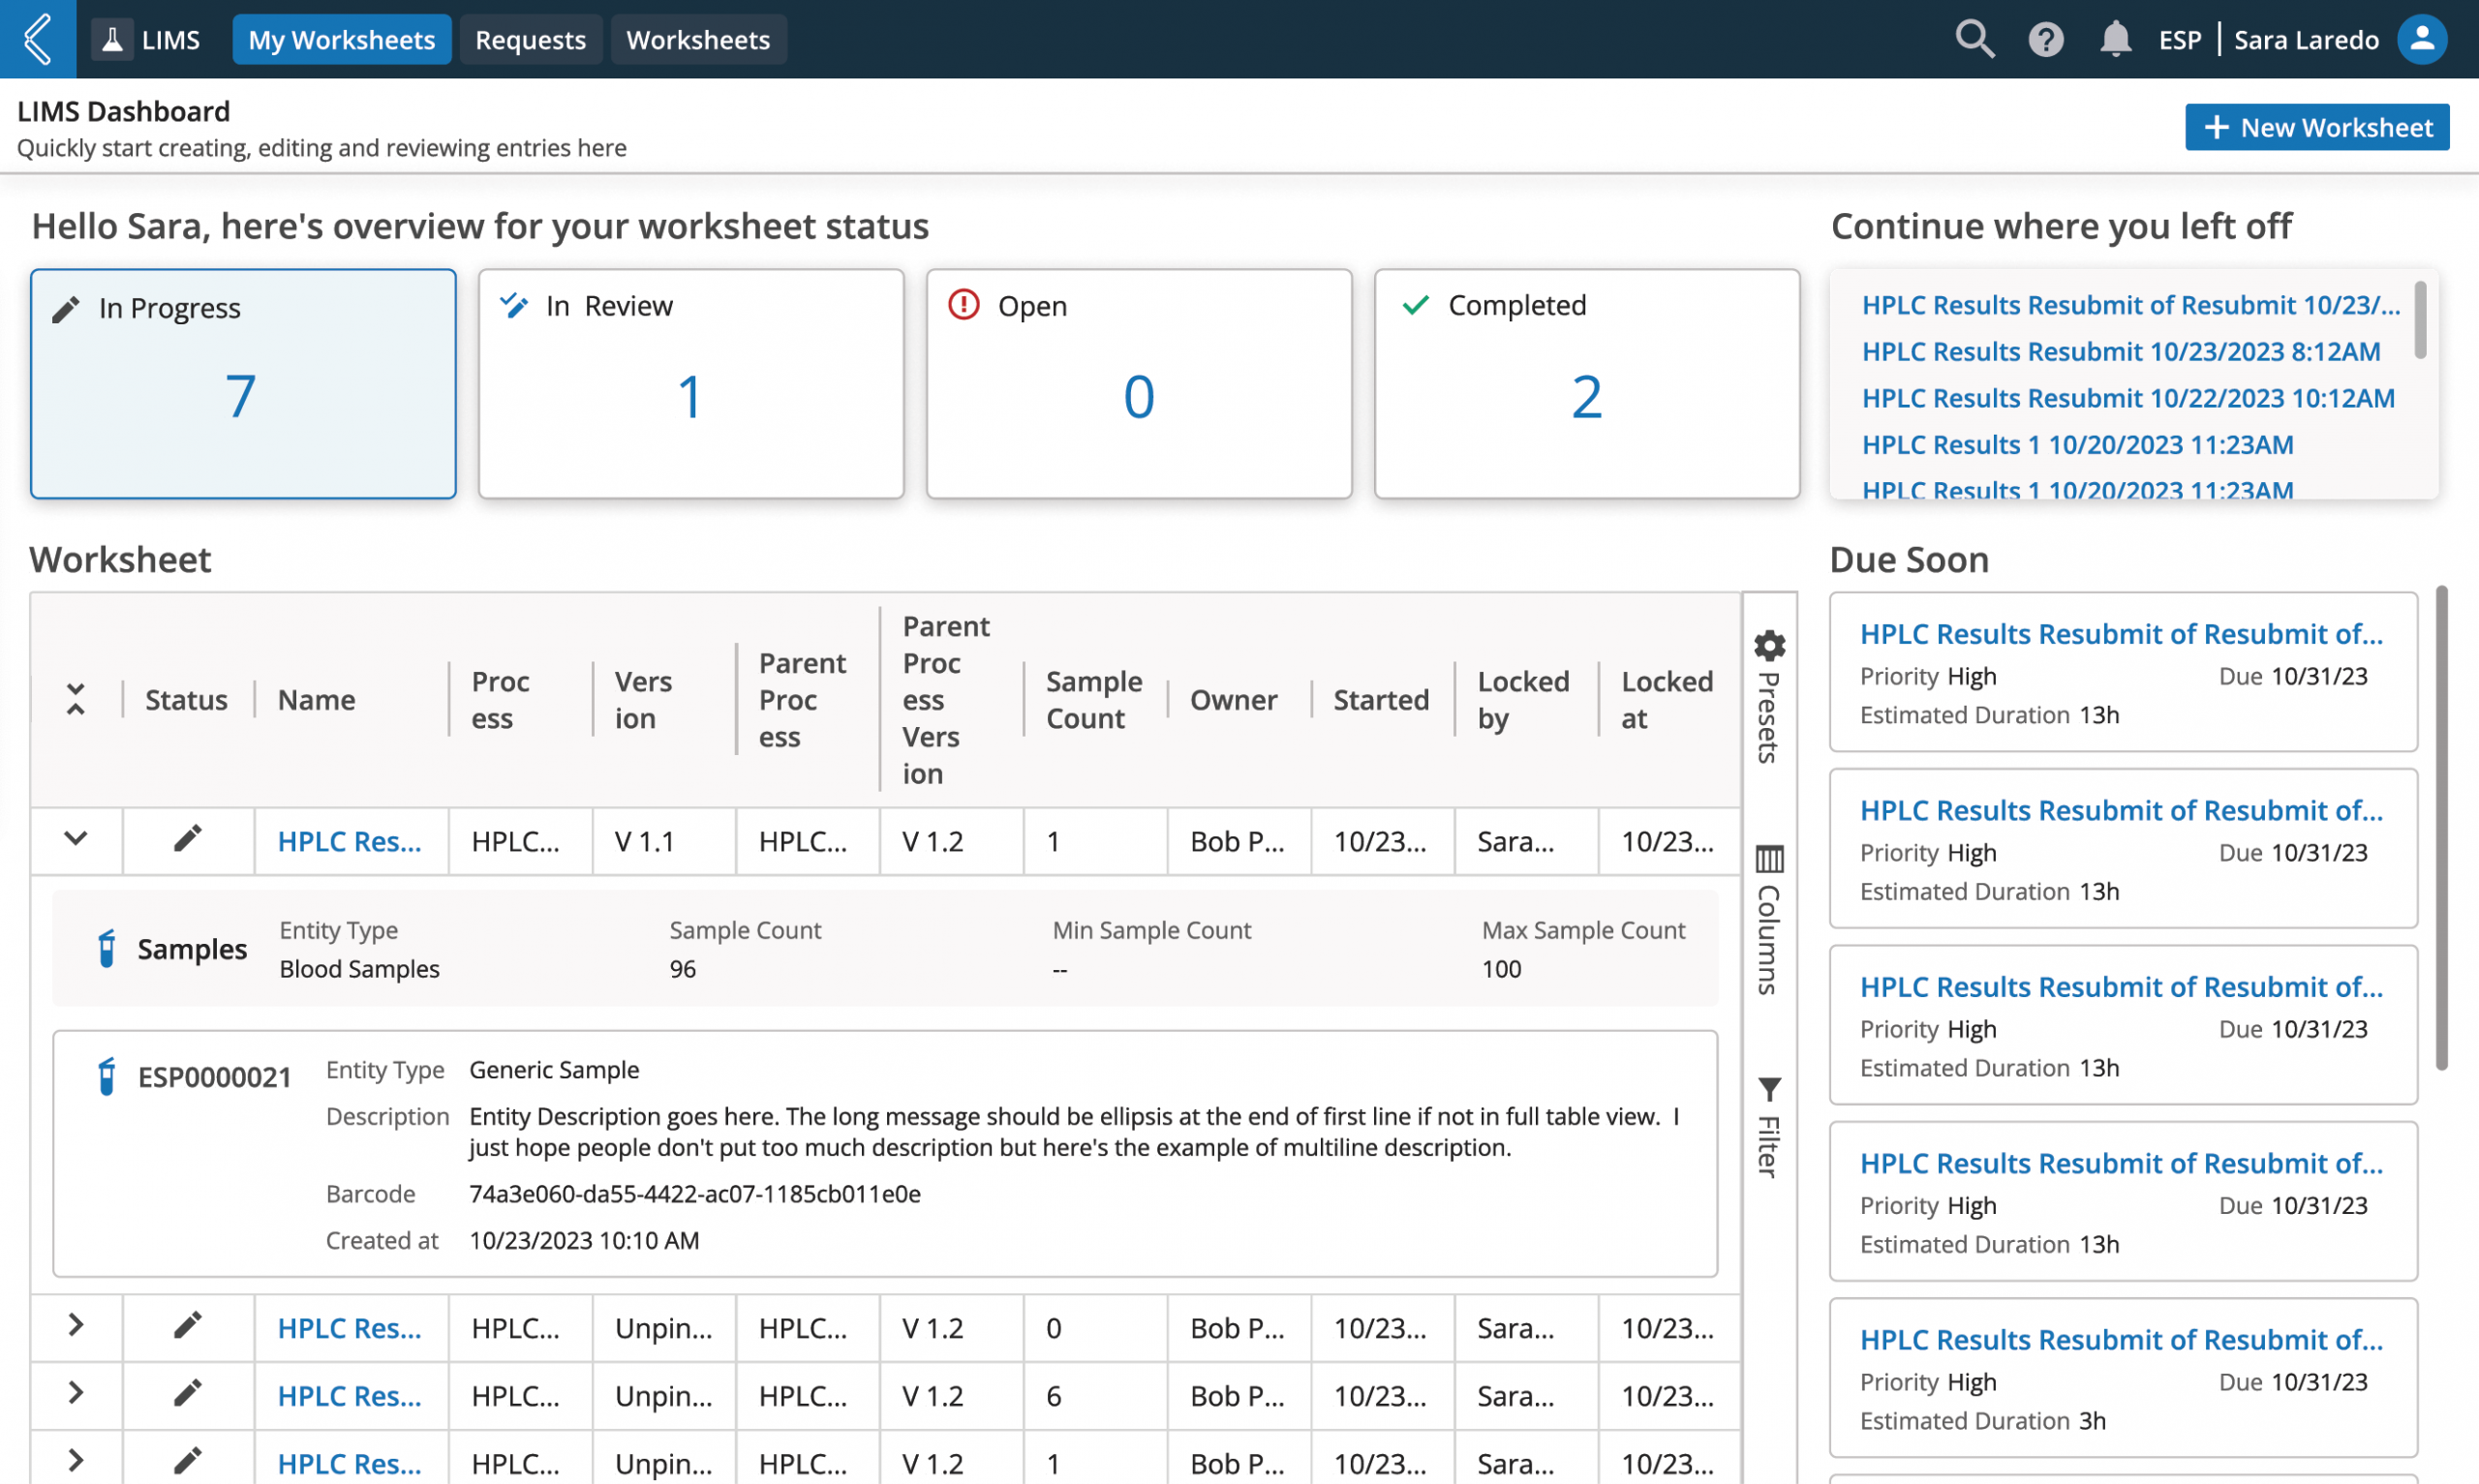
Not all dashboards are created equal. While a well-designed dashboard can tell the story of a project at a glance, many fall short.
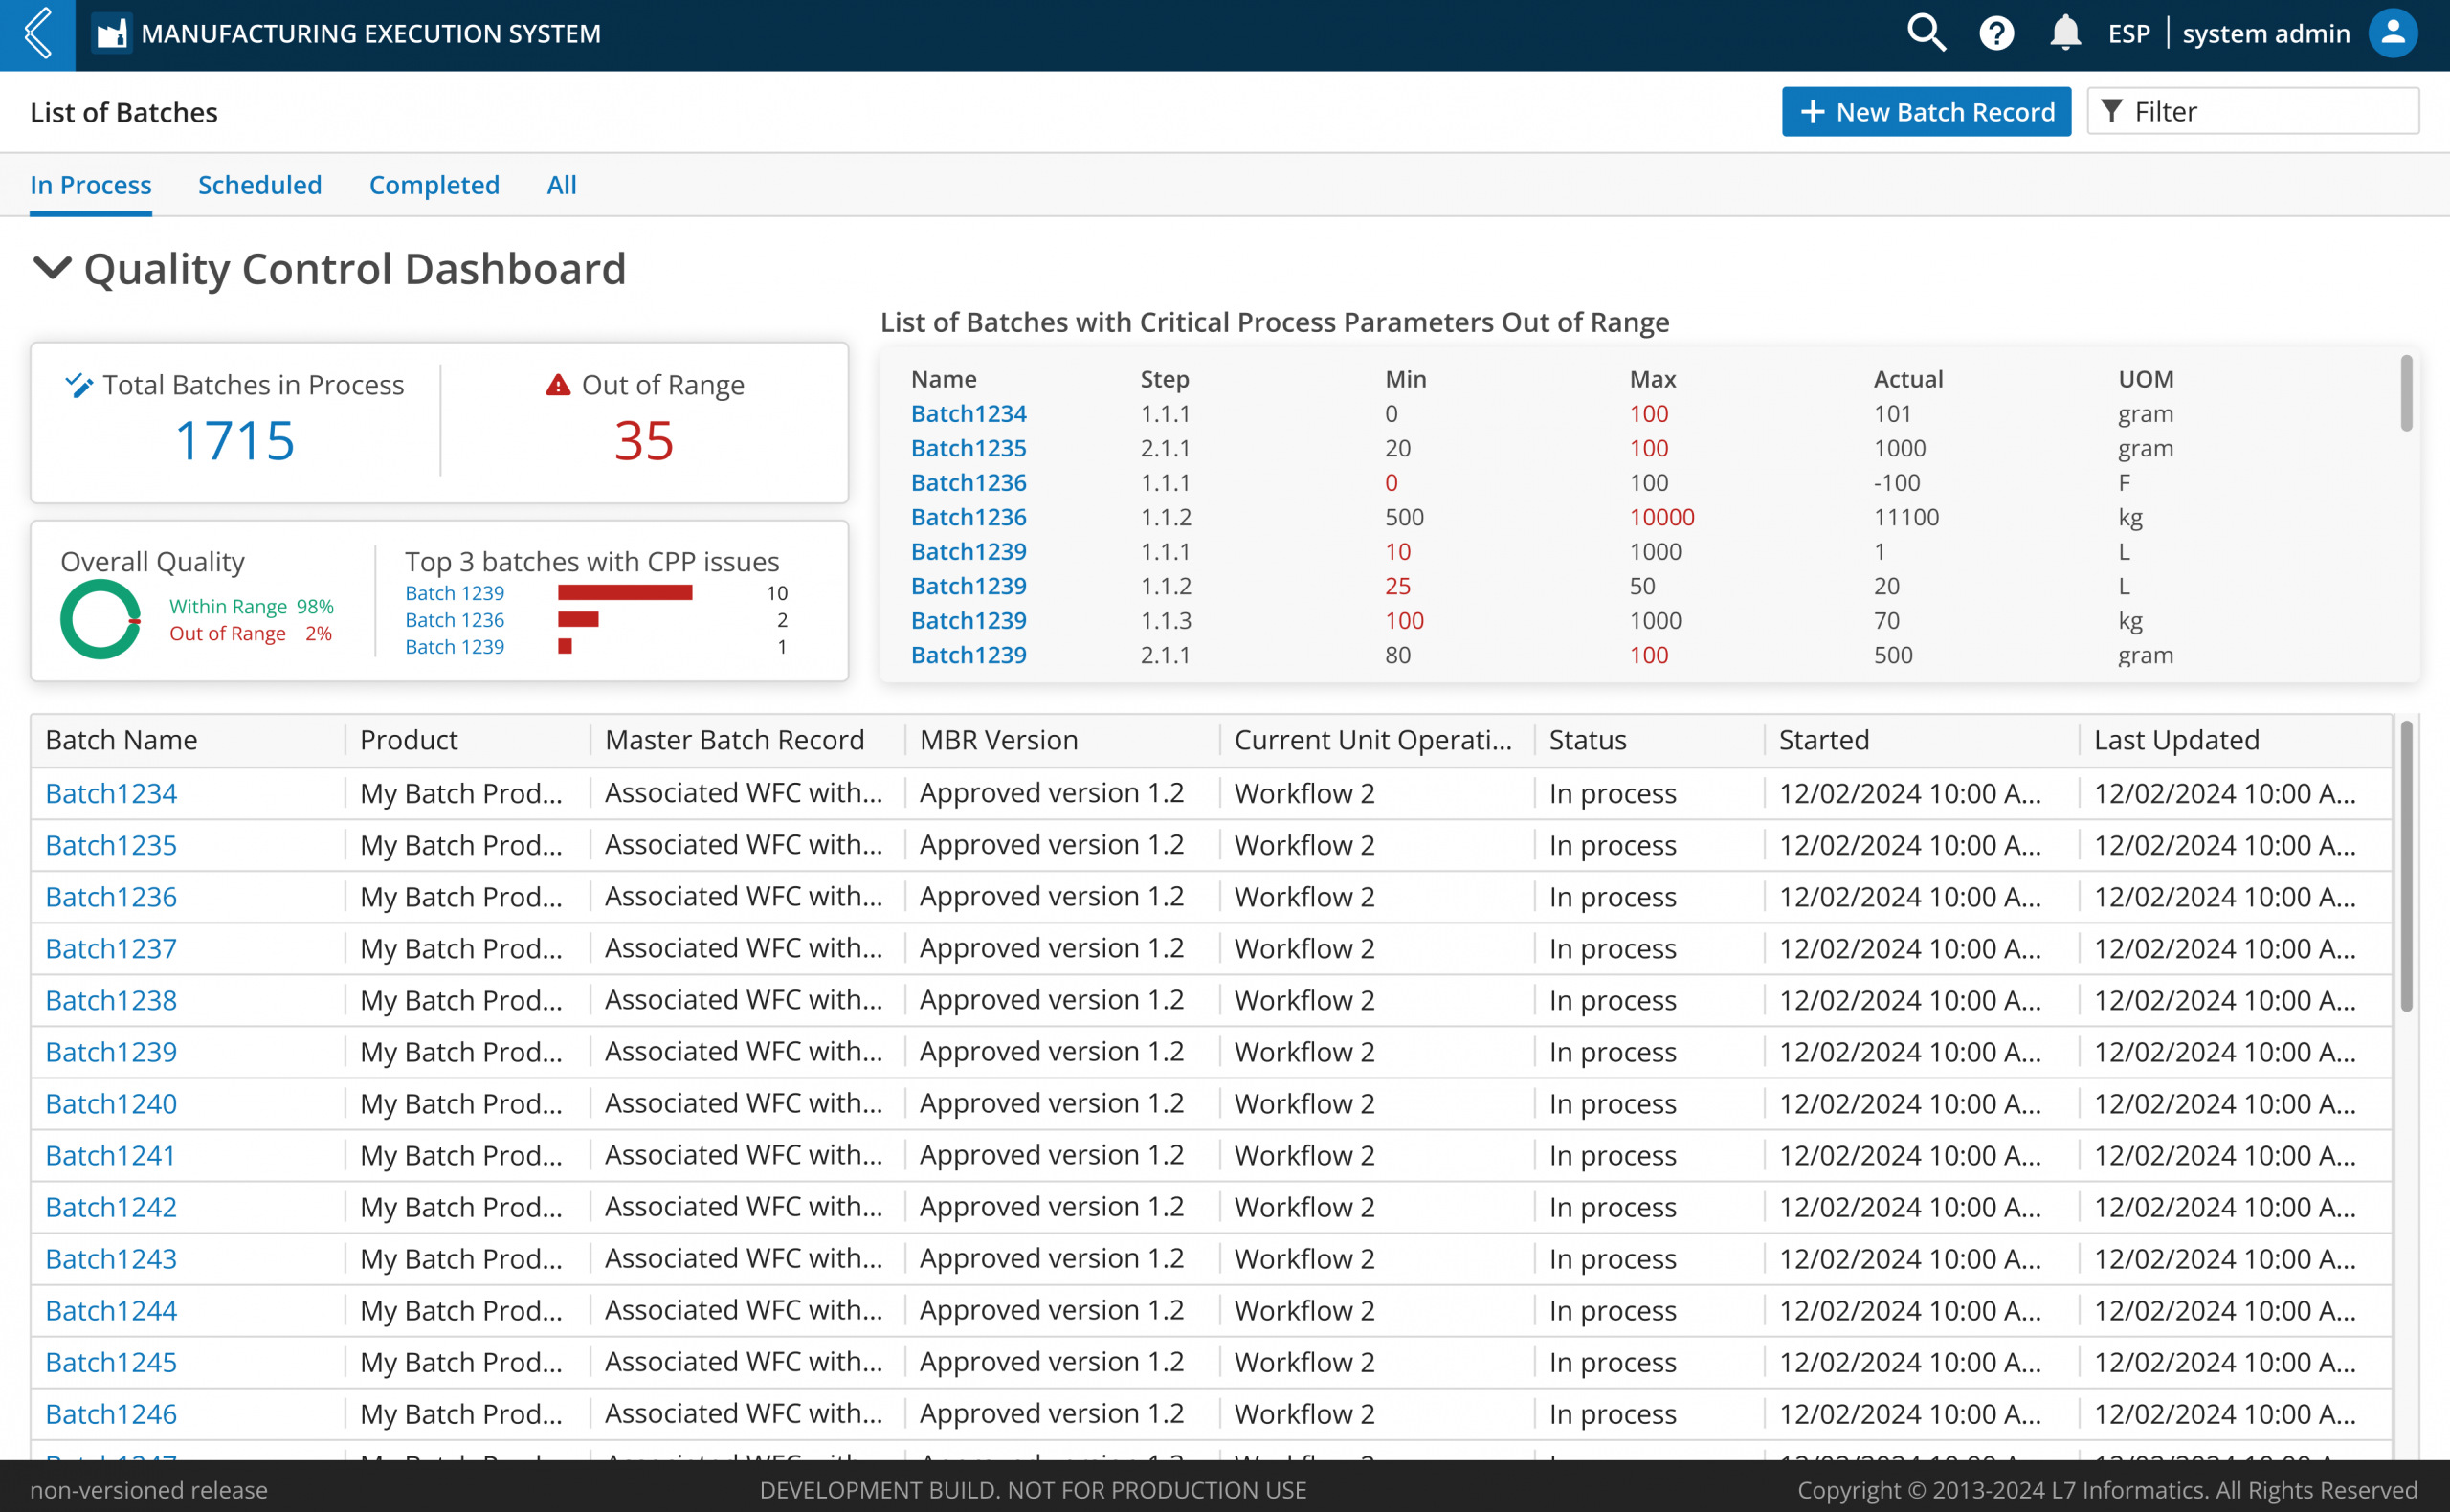
That’s why I created customized dashboards for each app. Because each app has a different usage, audience, and story to tell. These tailored views communicate trends, patterns, urgency, and overall project status in a way that’s meaningful and actionable for users who understand the context.
REPORT DESIGN
– An Audit Ready Report
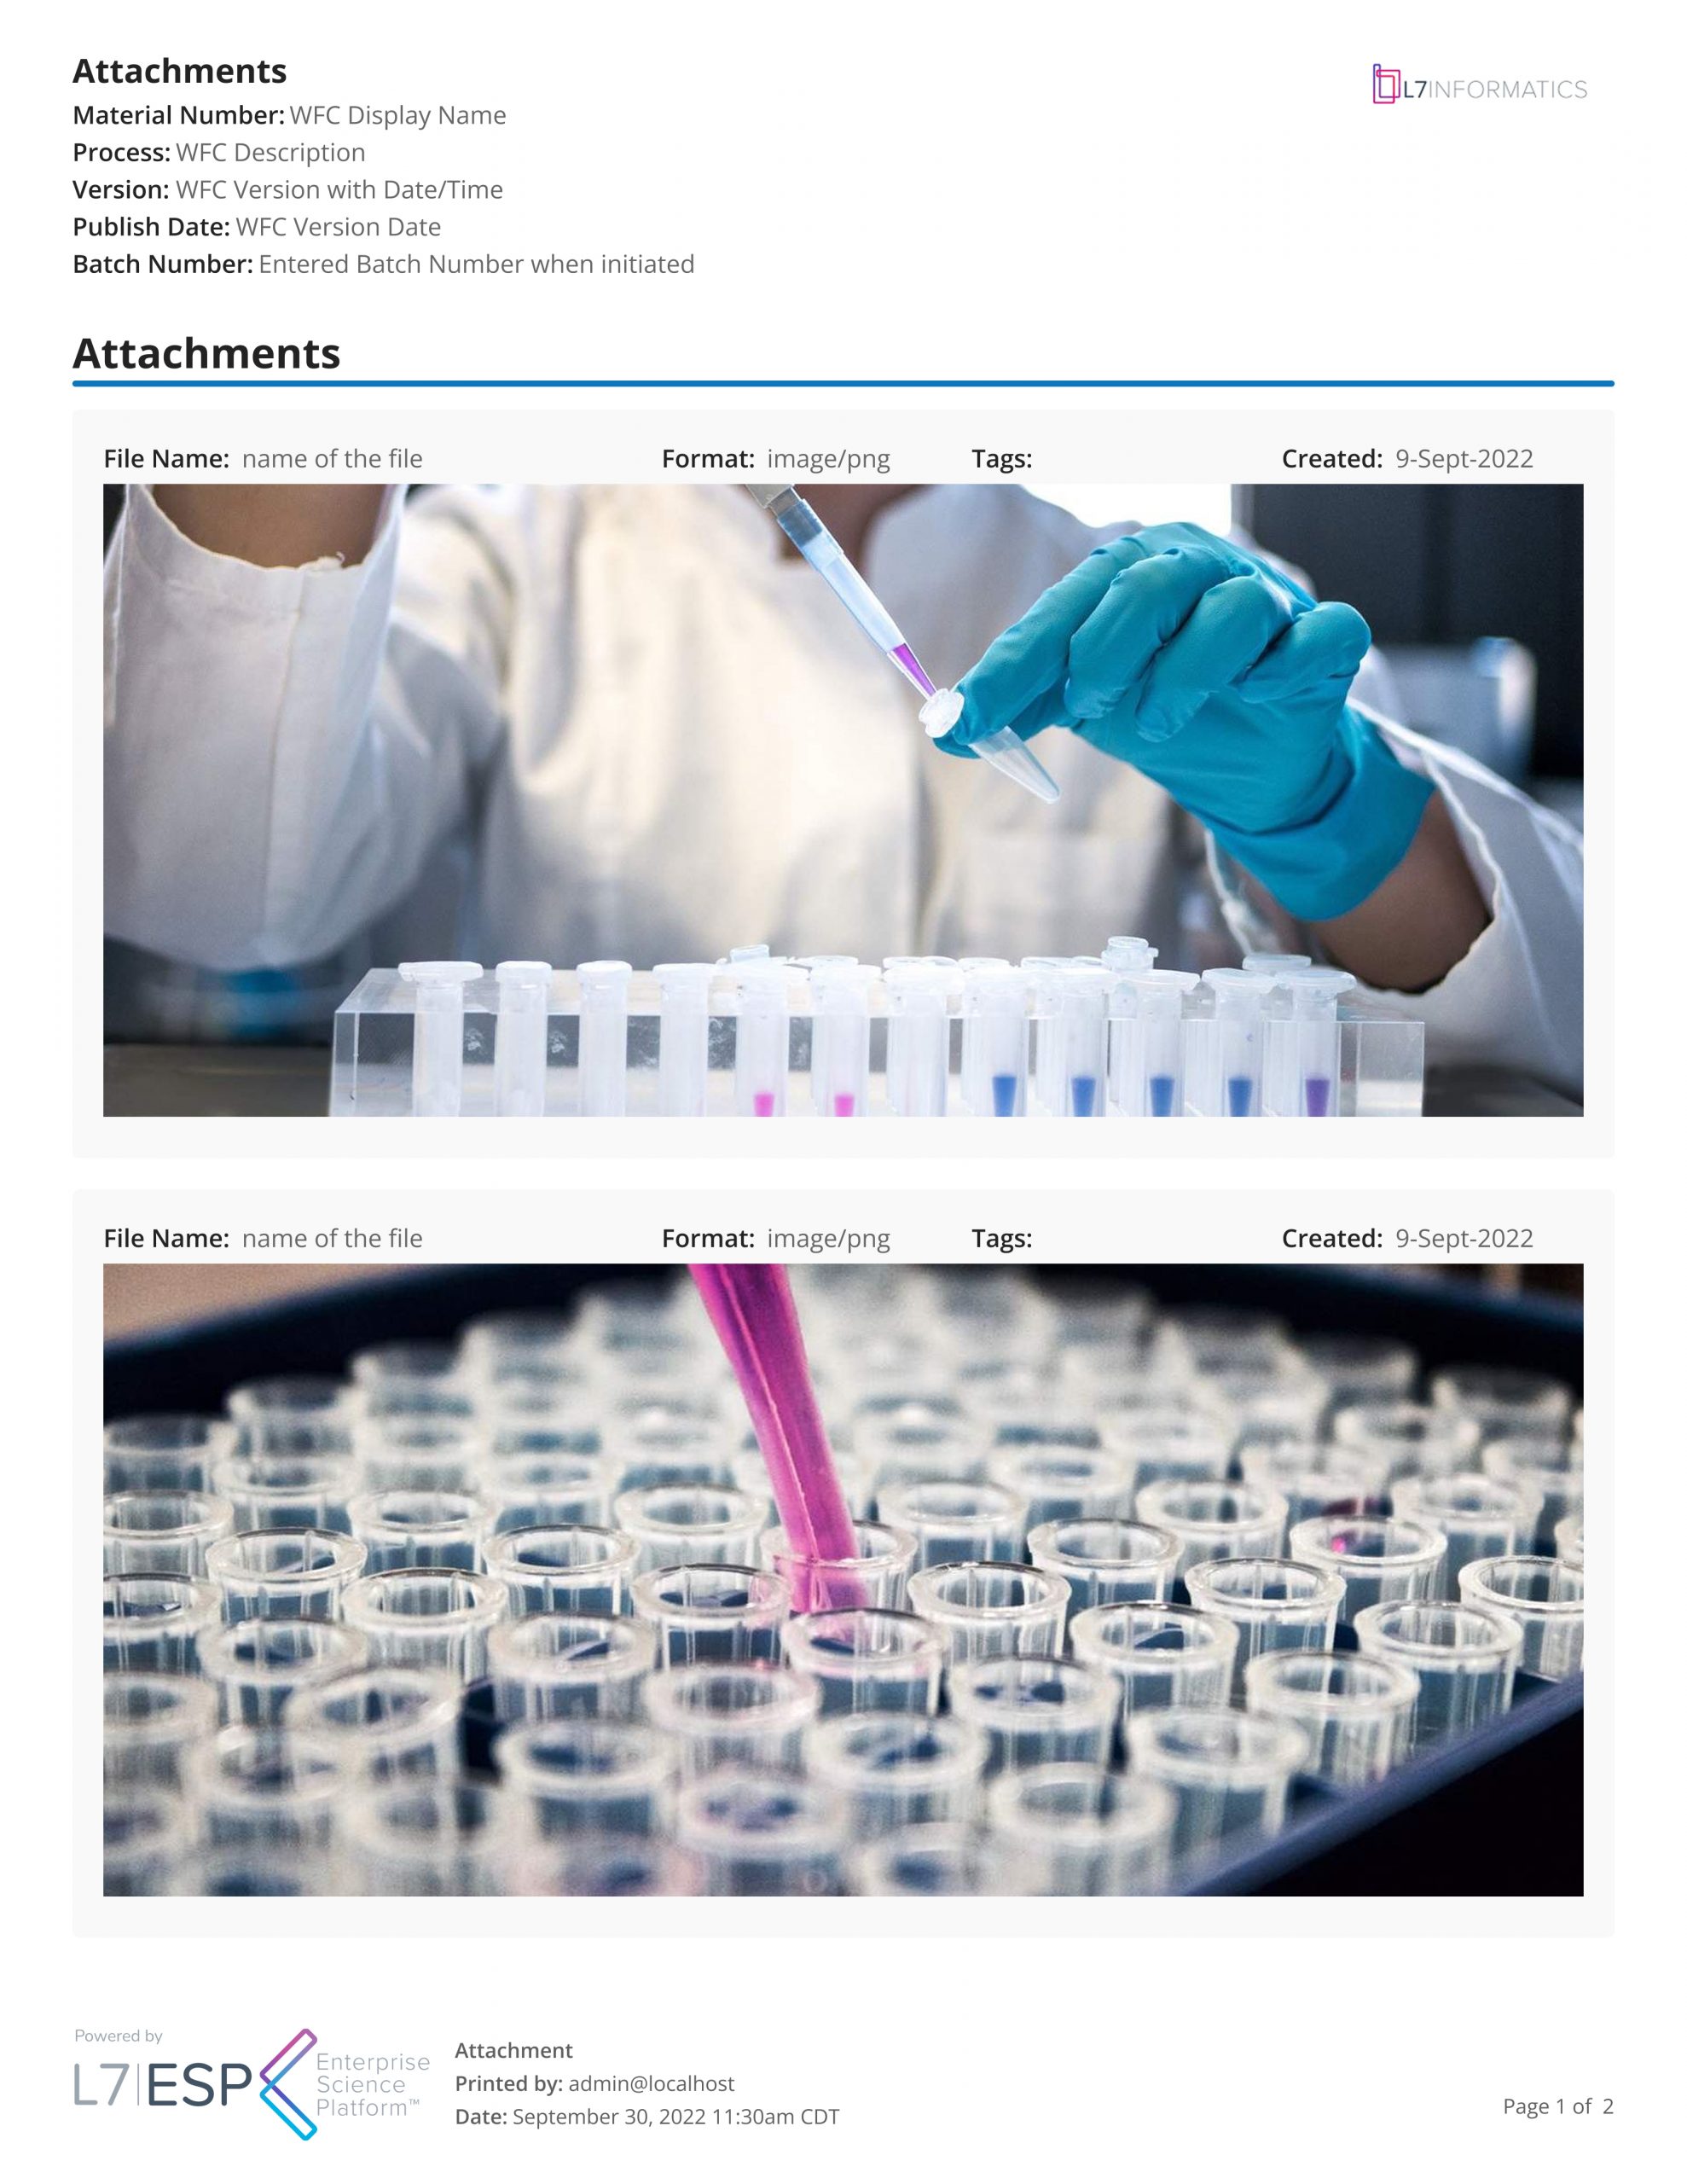
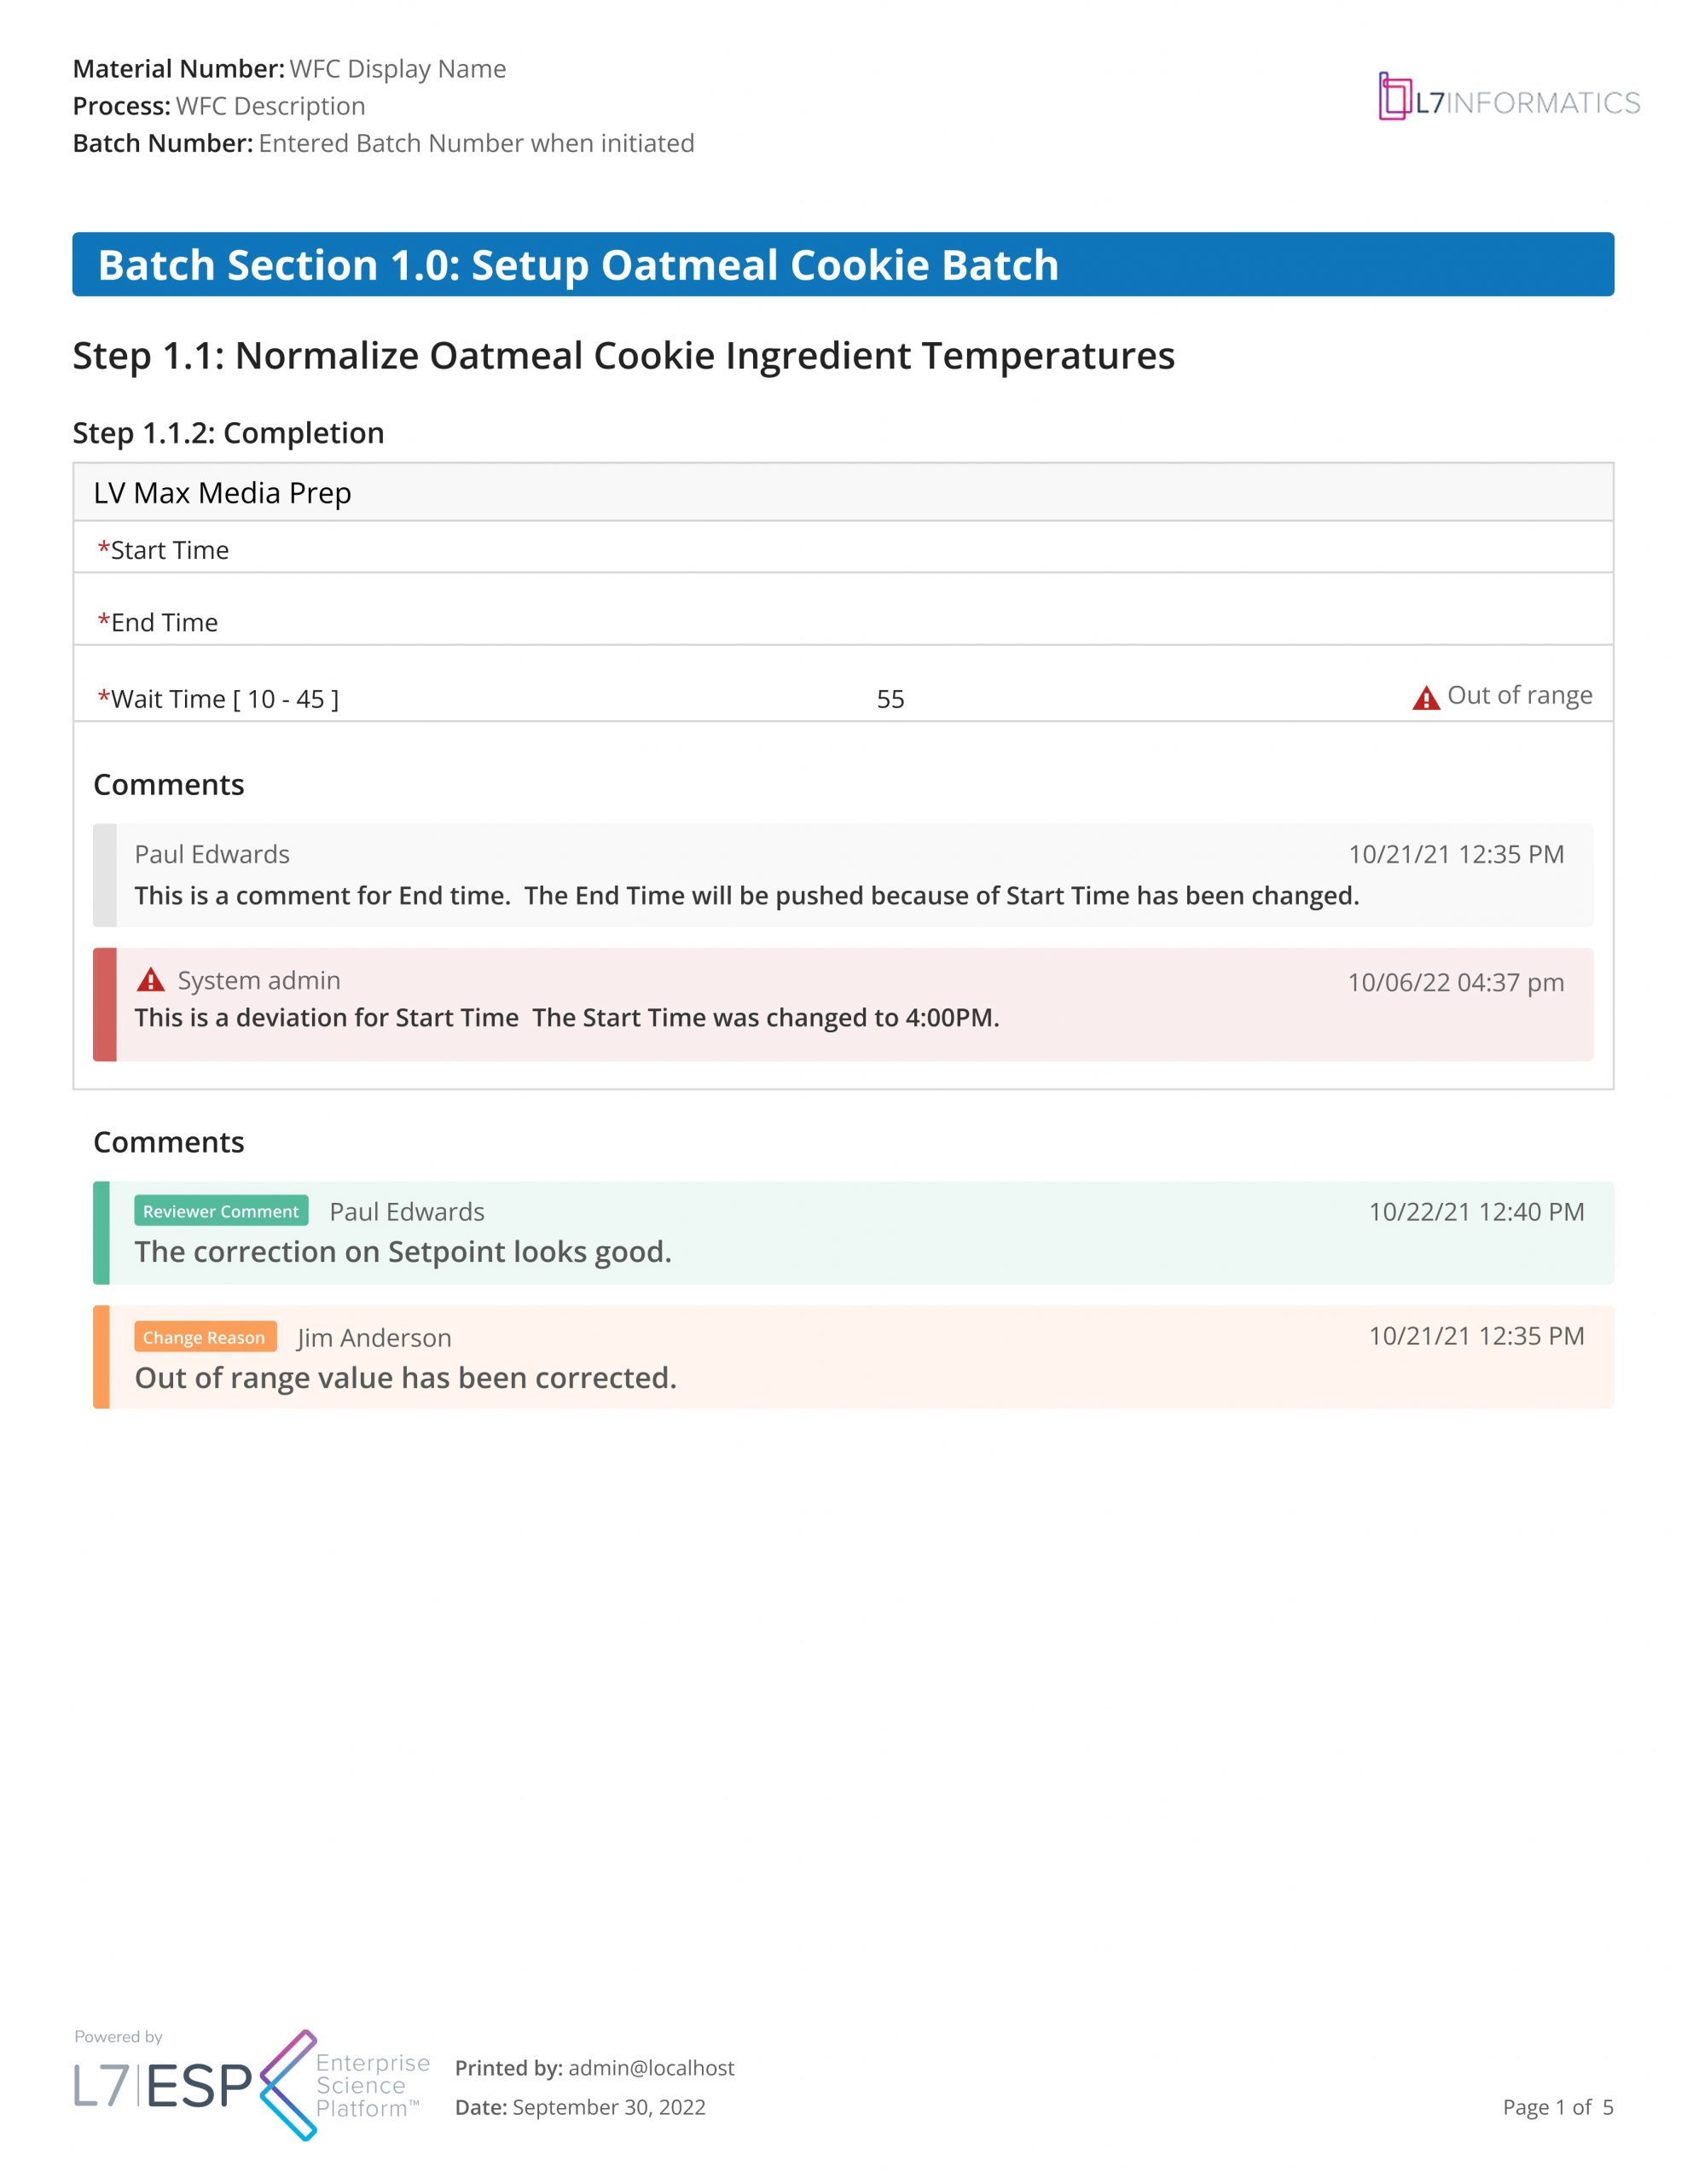
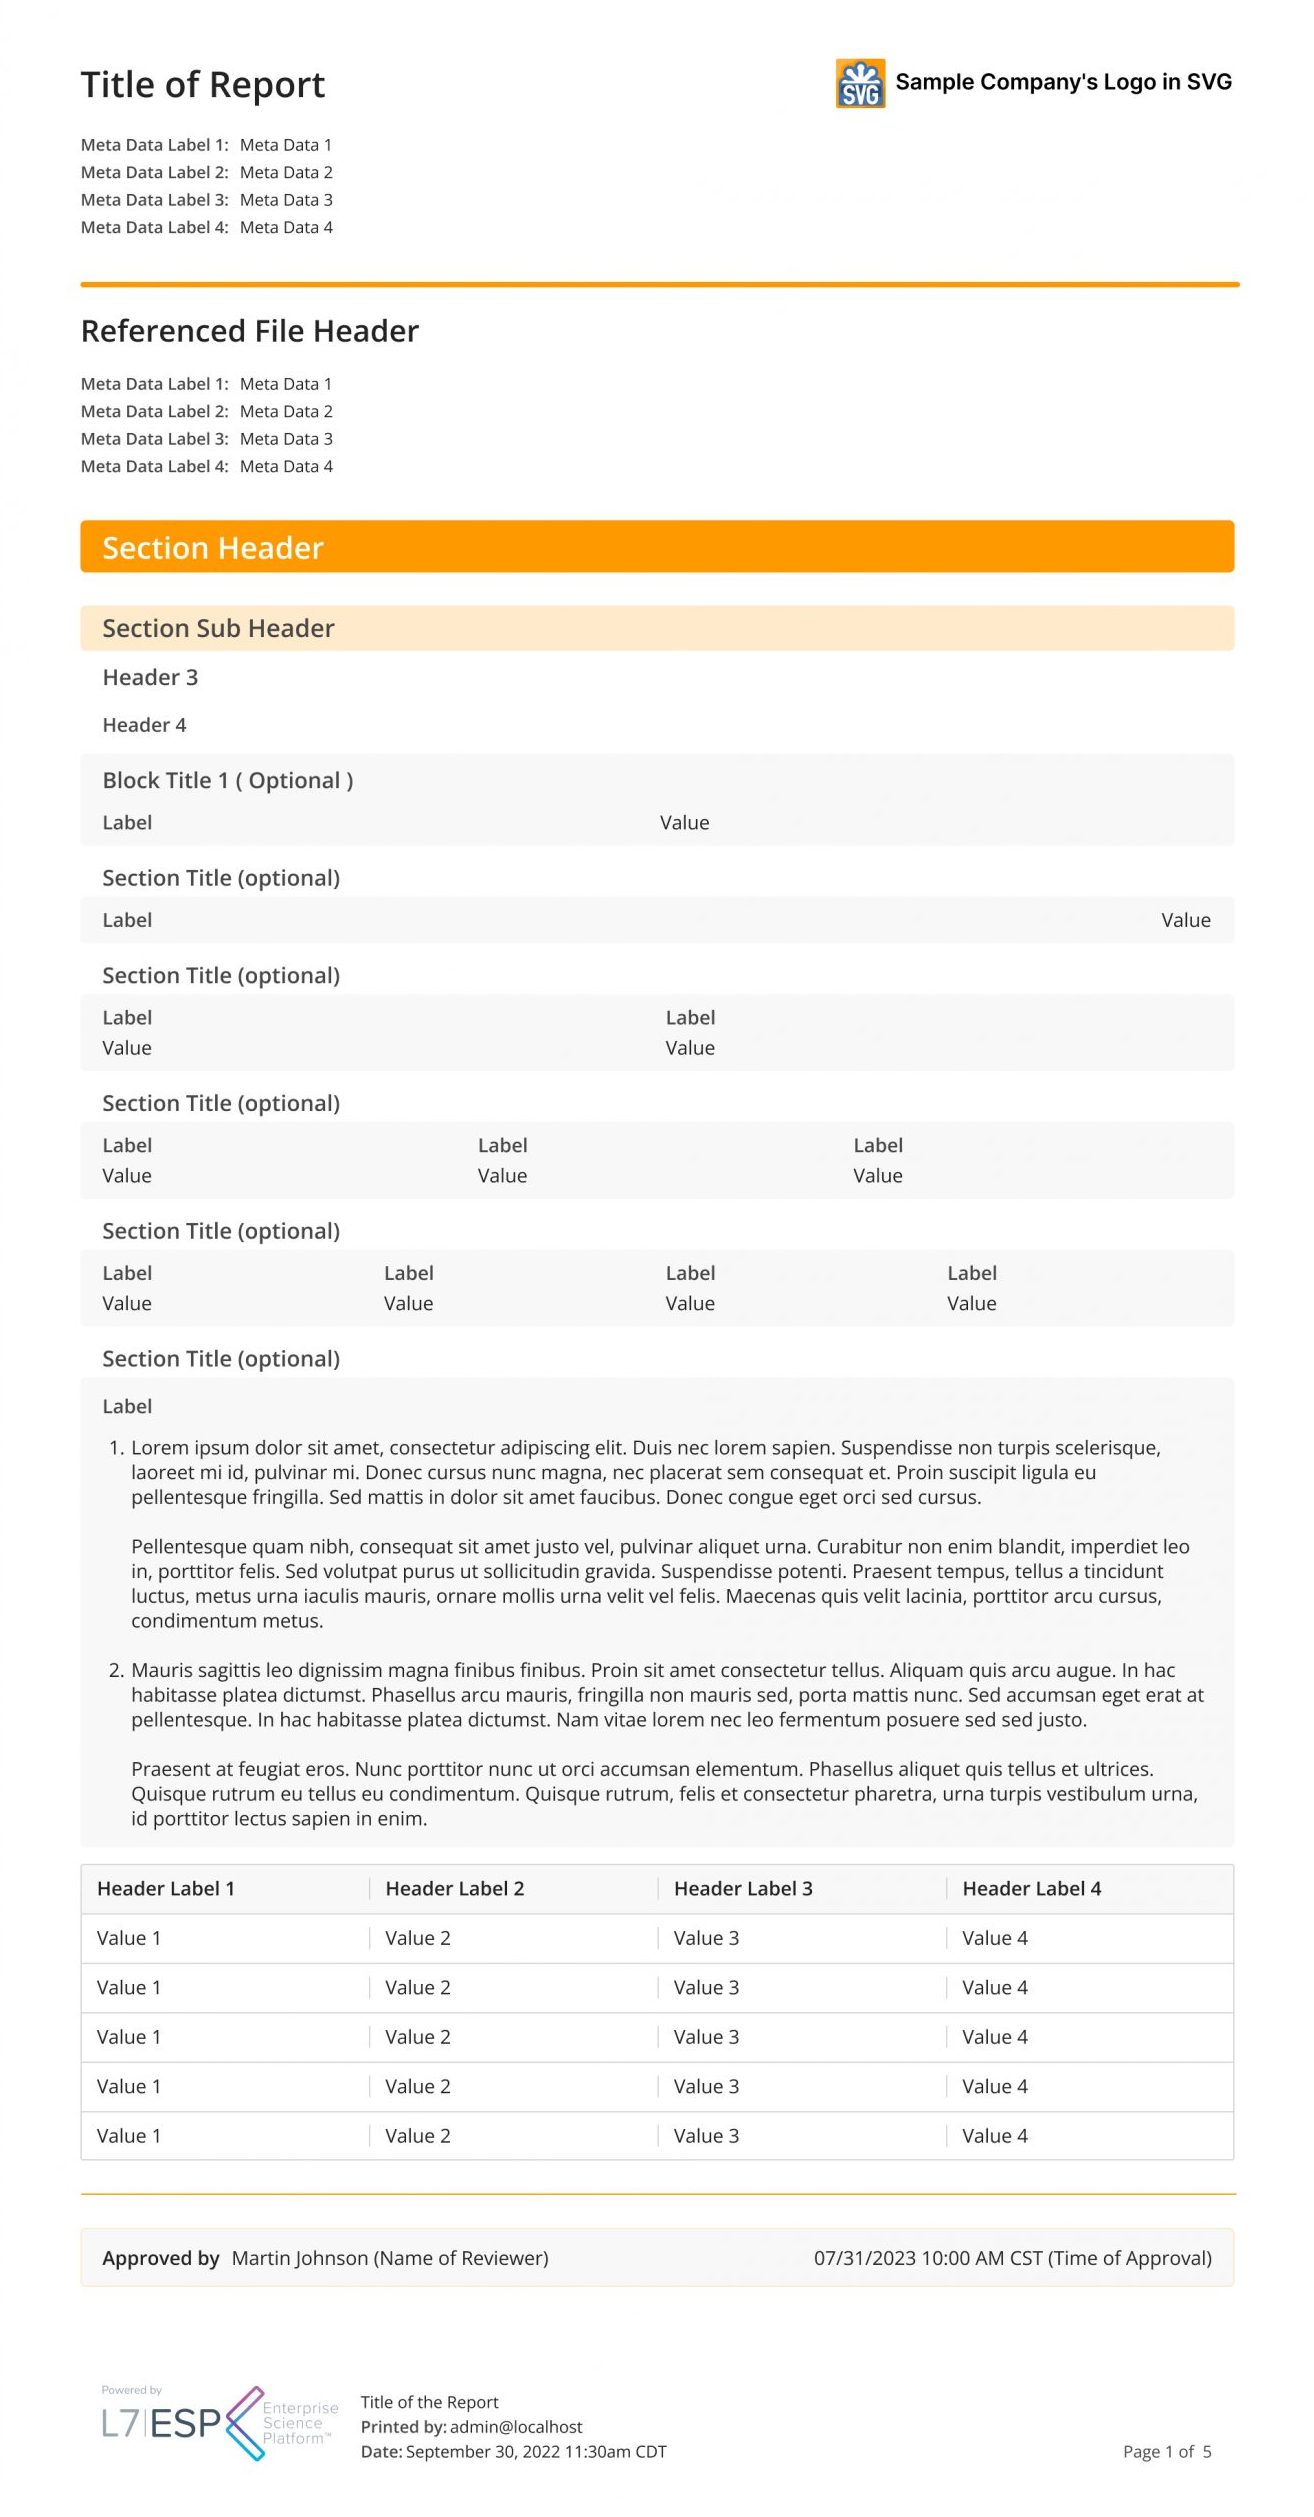
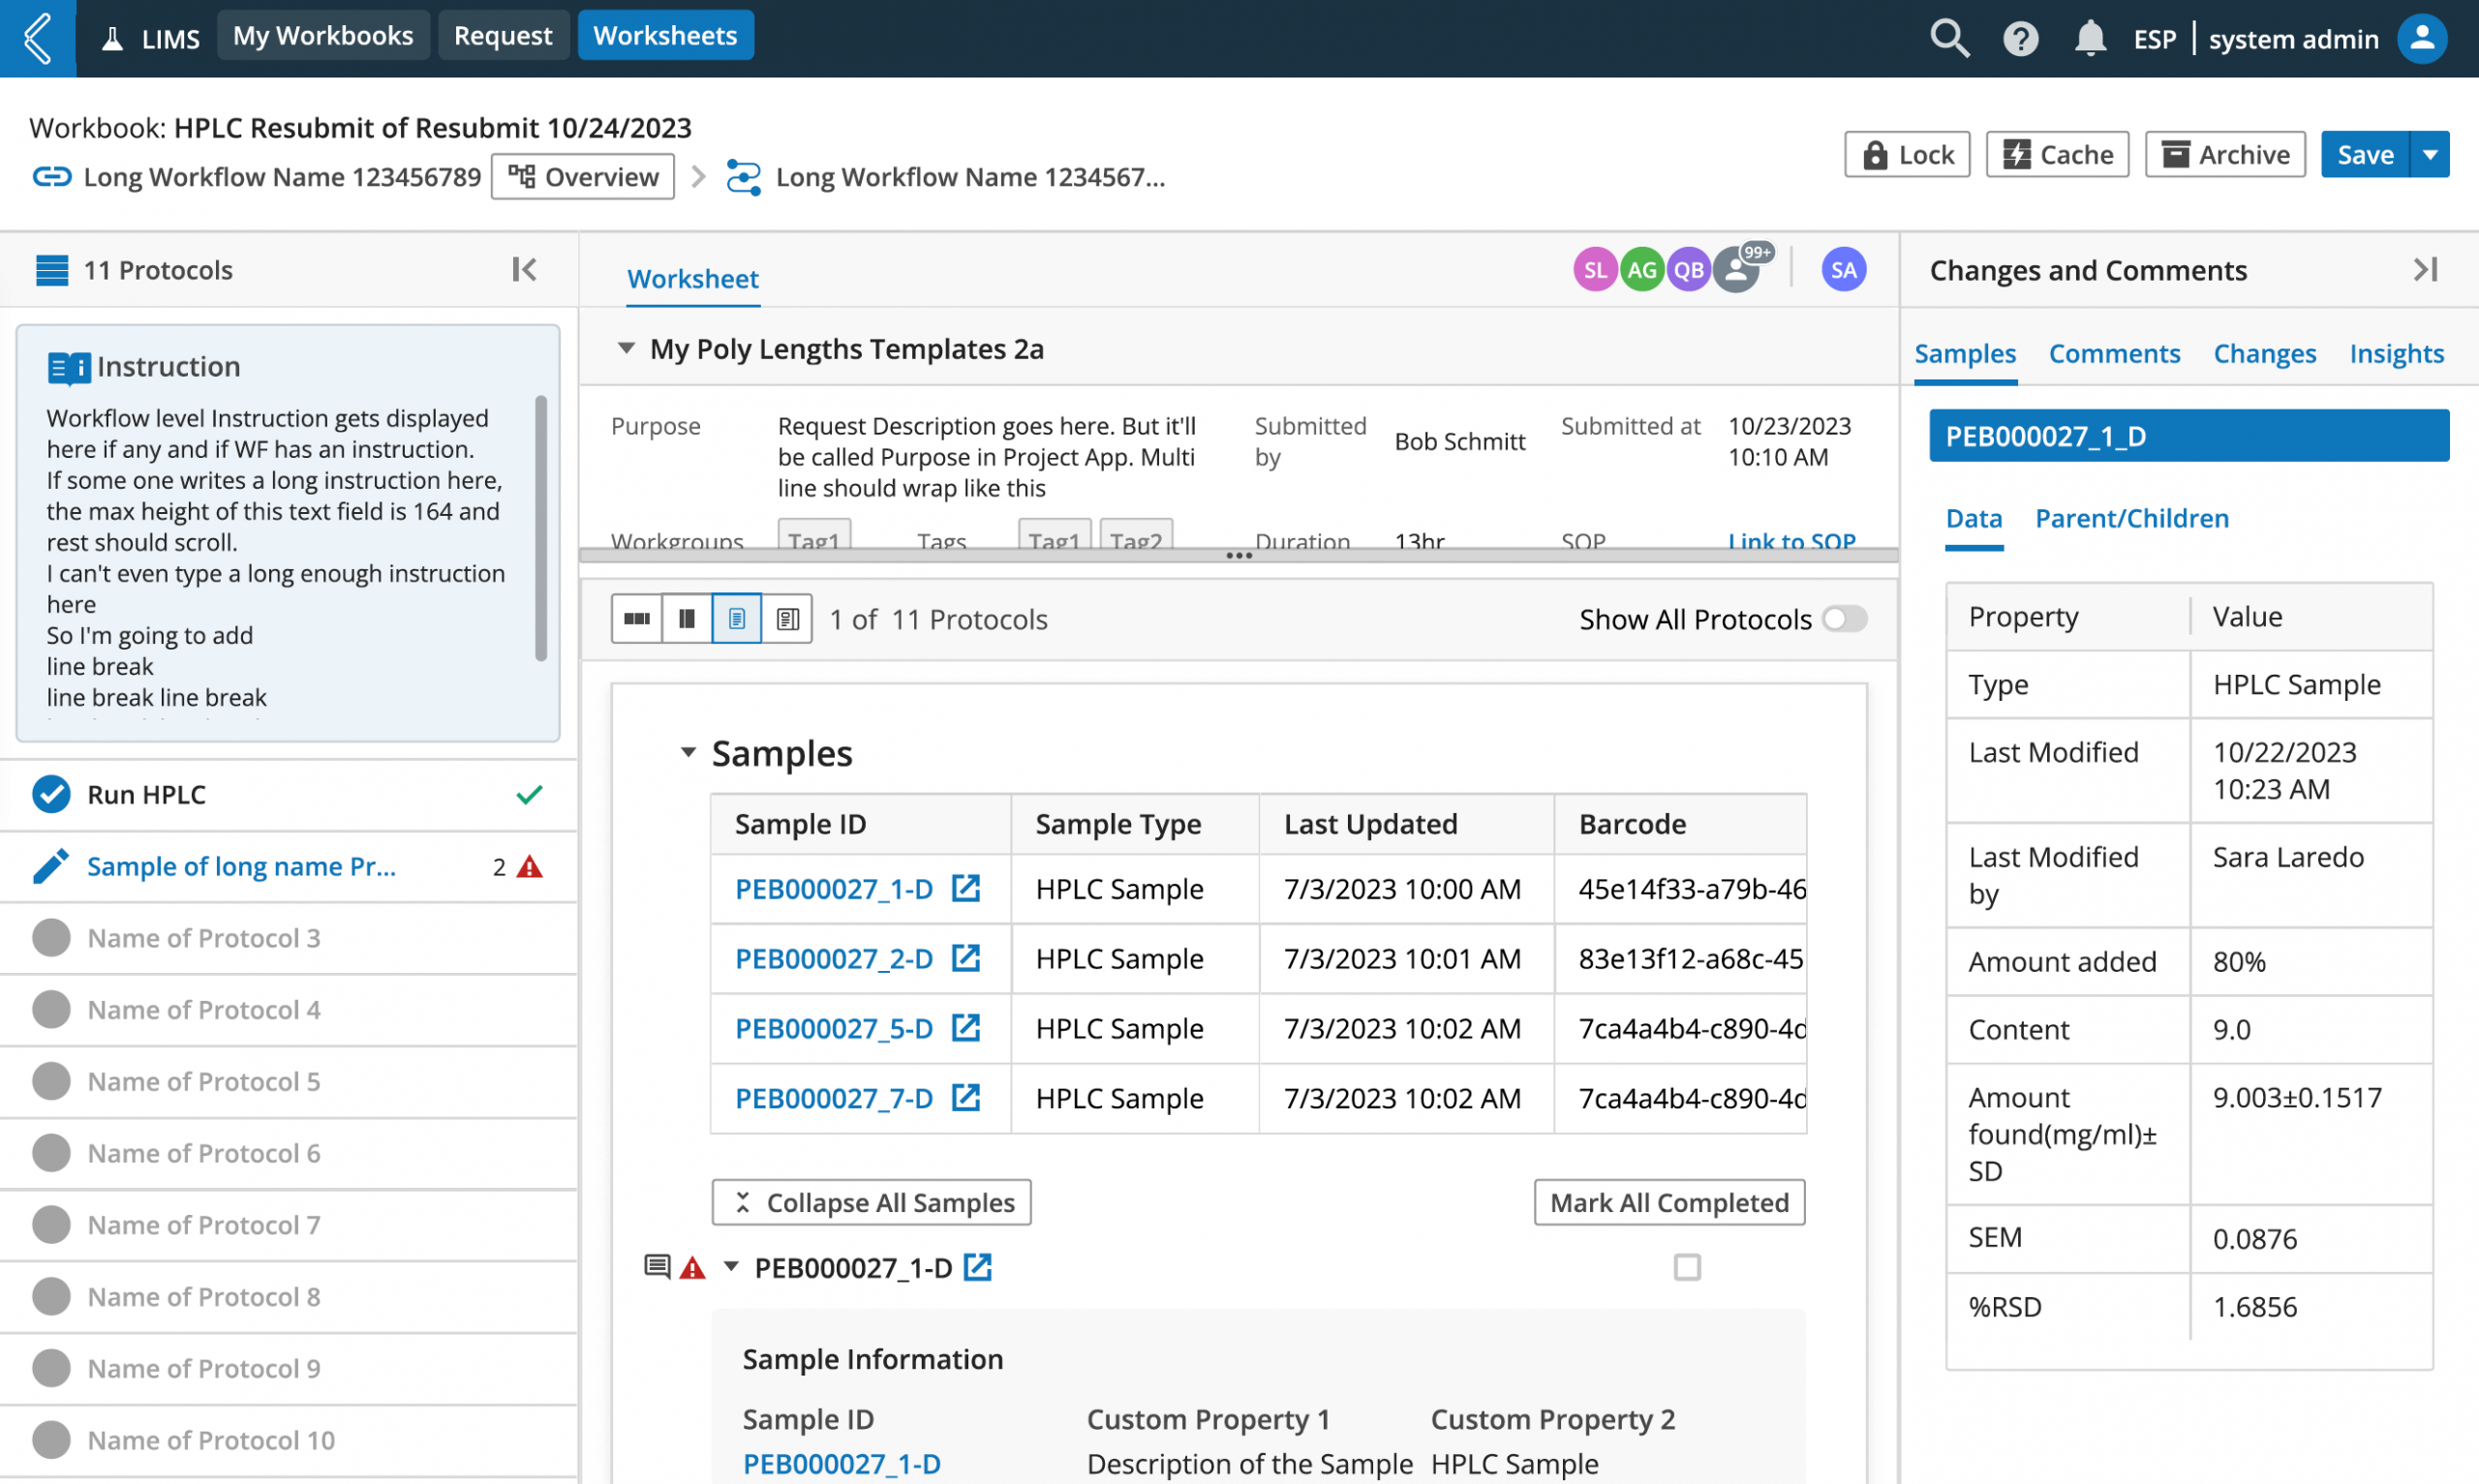
From Final Batch Report to Experiment Report, easy to read and accurate Report is a crucial feature to any company’s success.
This is where I designed a Report system that is consistent yet highly customizable for GMP customers and users can get audit ready reports that ensures product quality with a click of a button.
INTUITIVE INTERFACE DESIGN
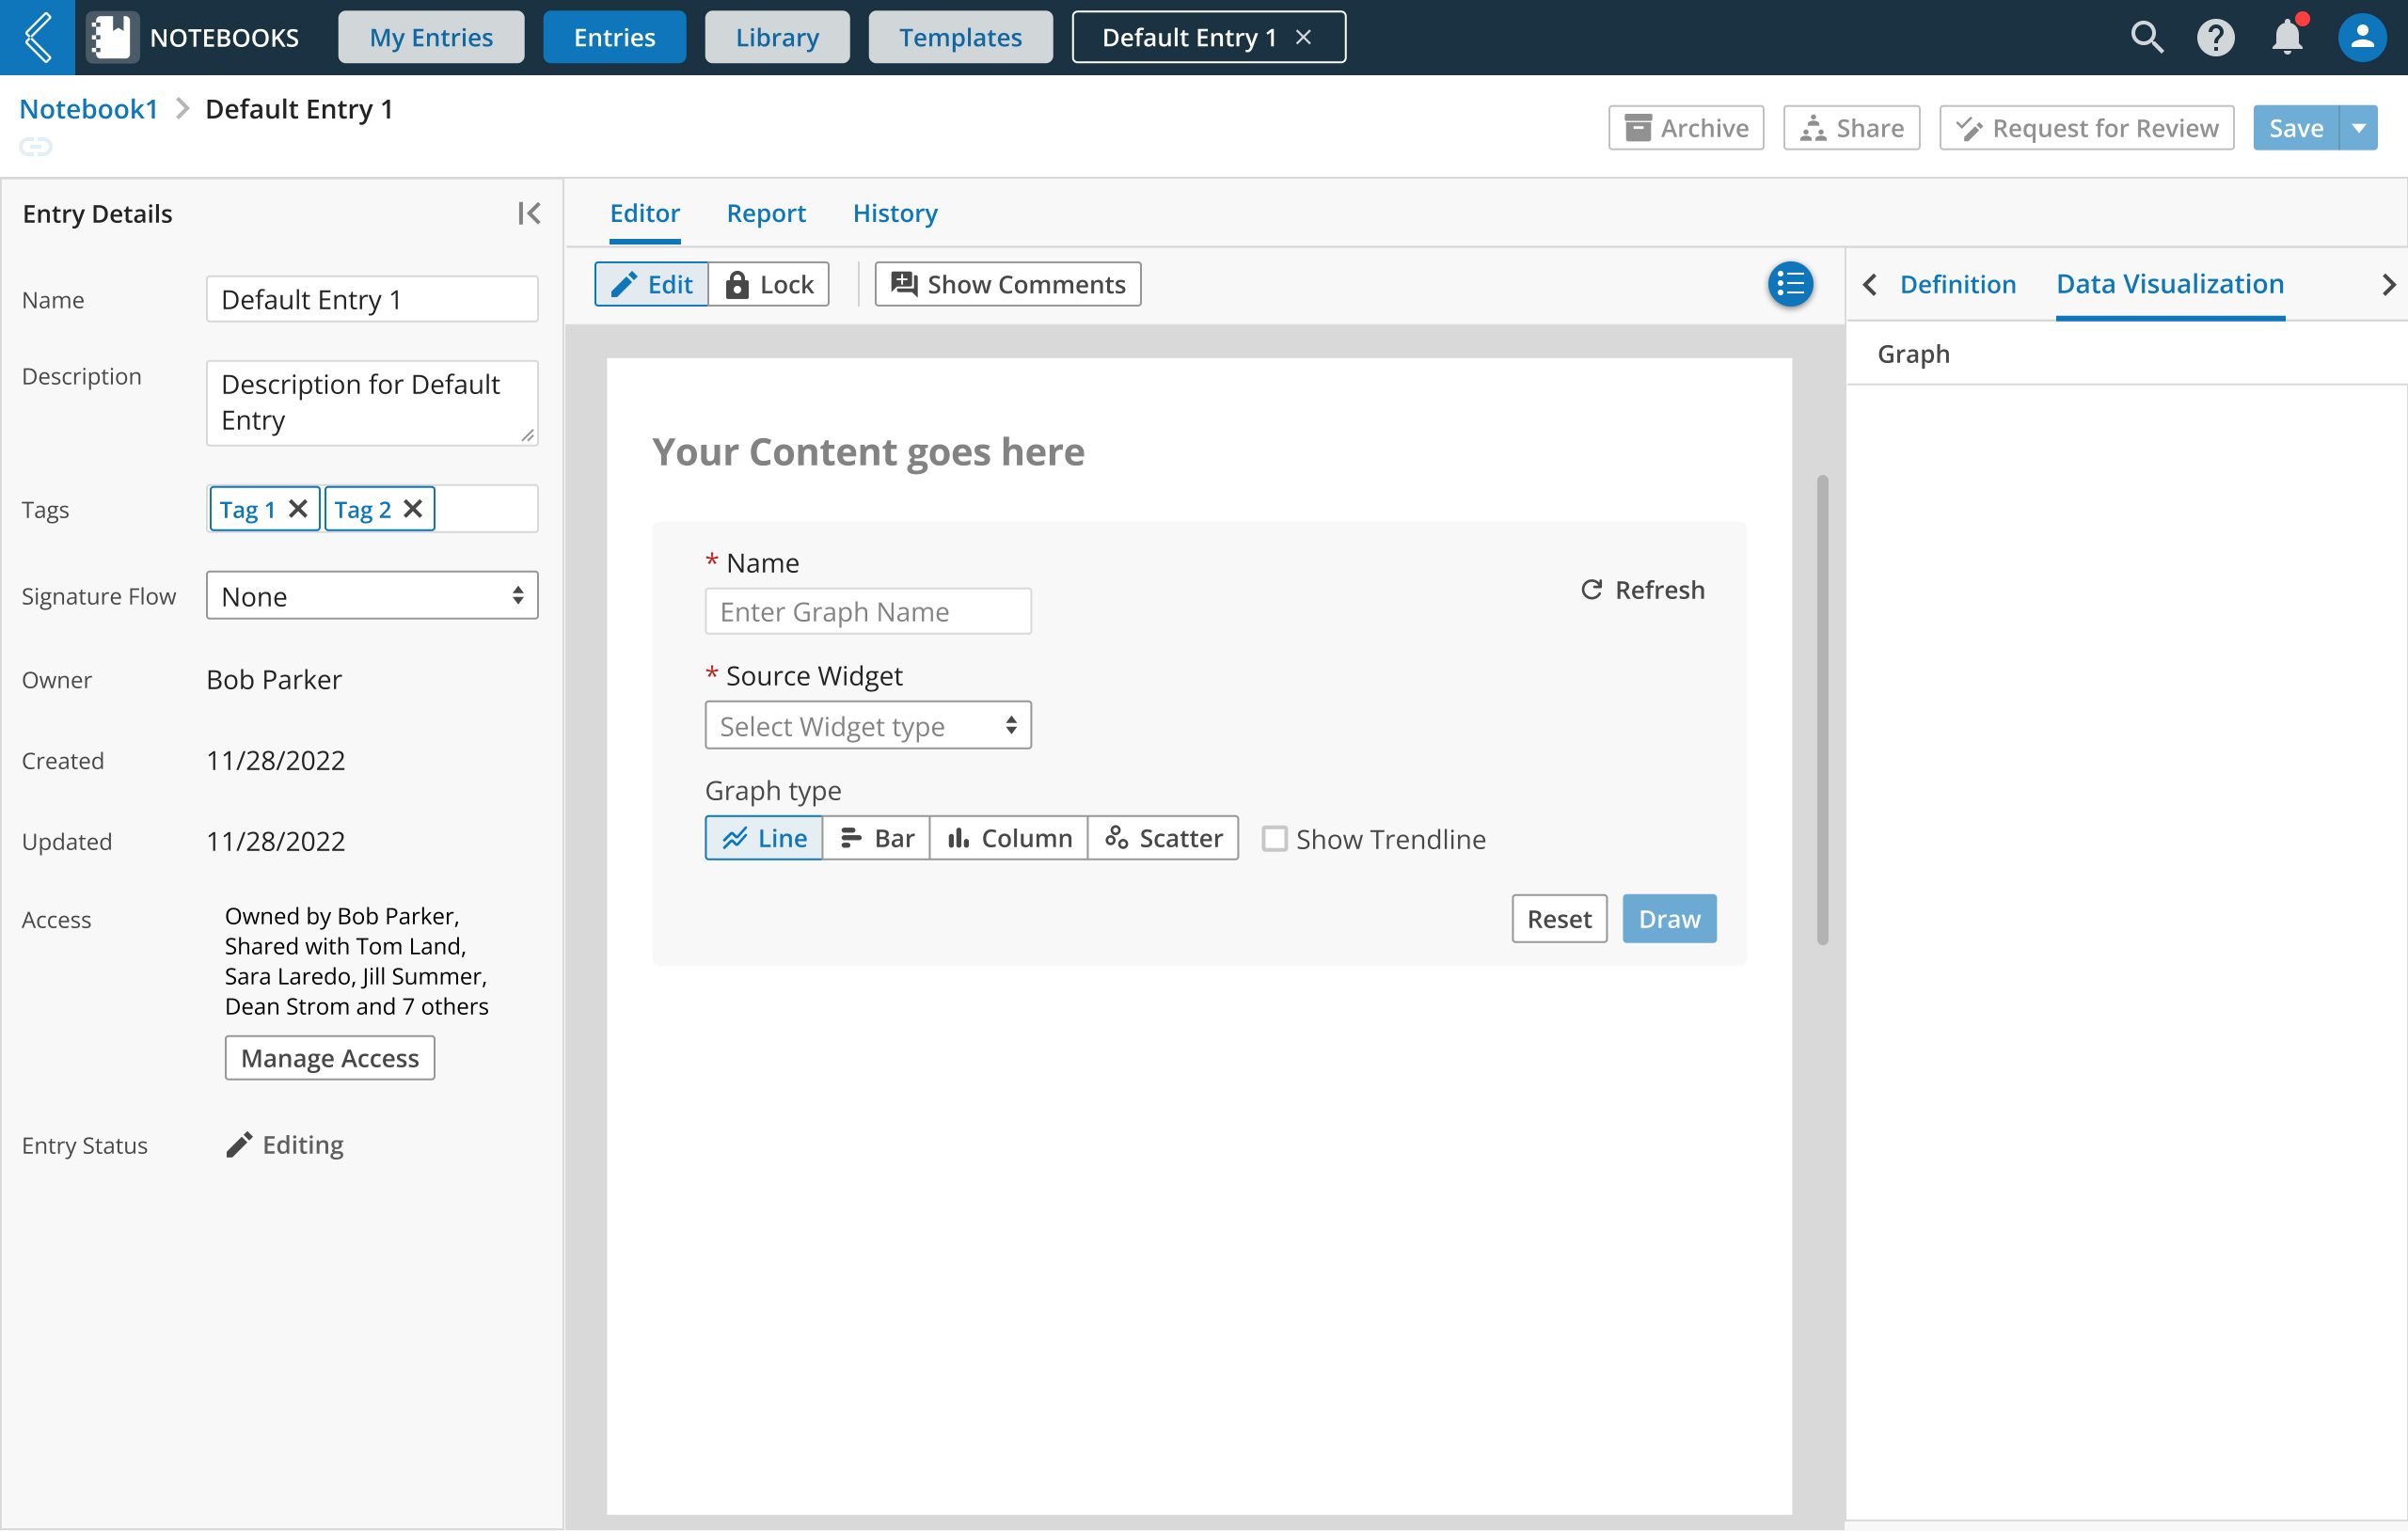
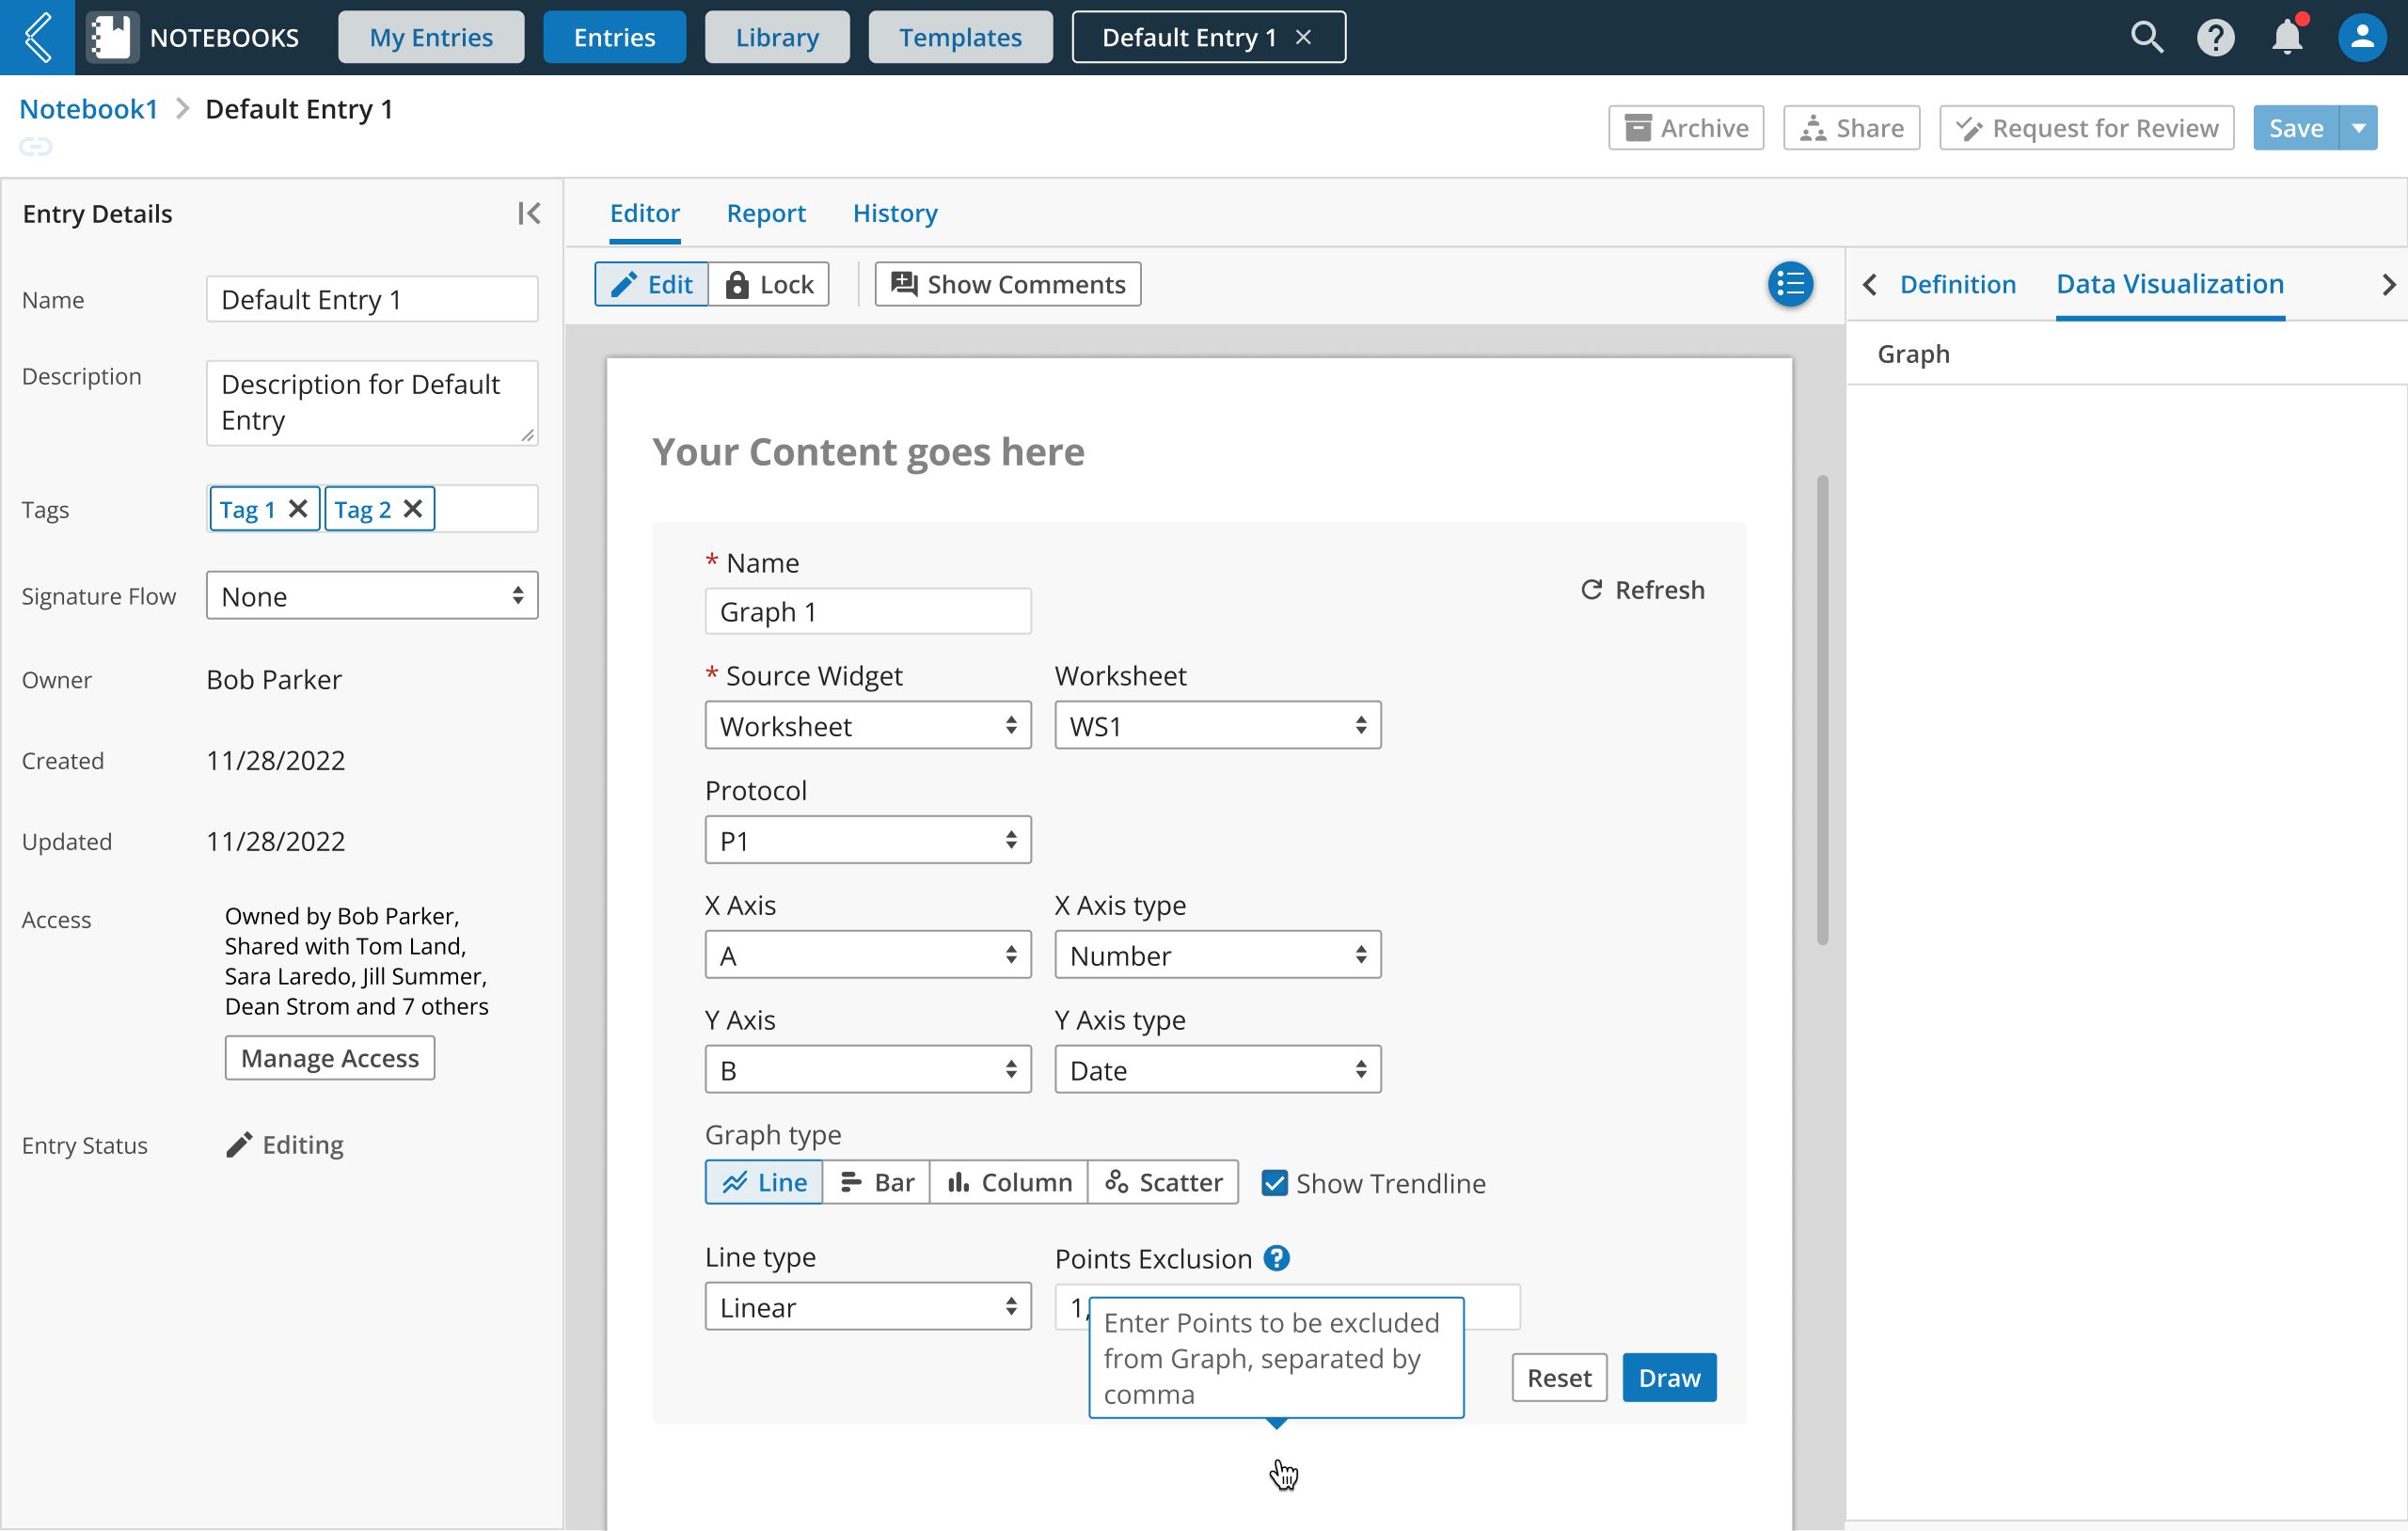
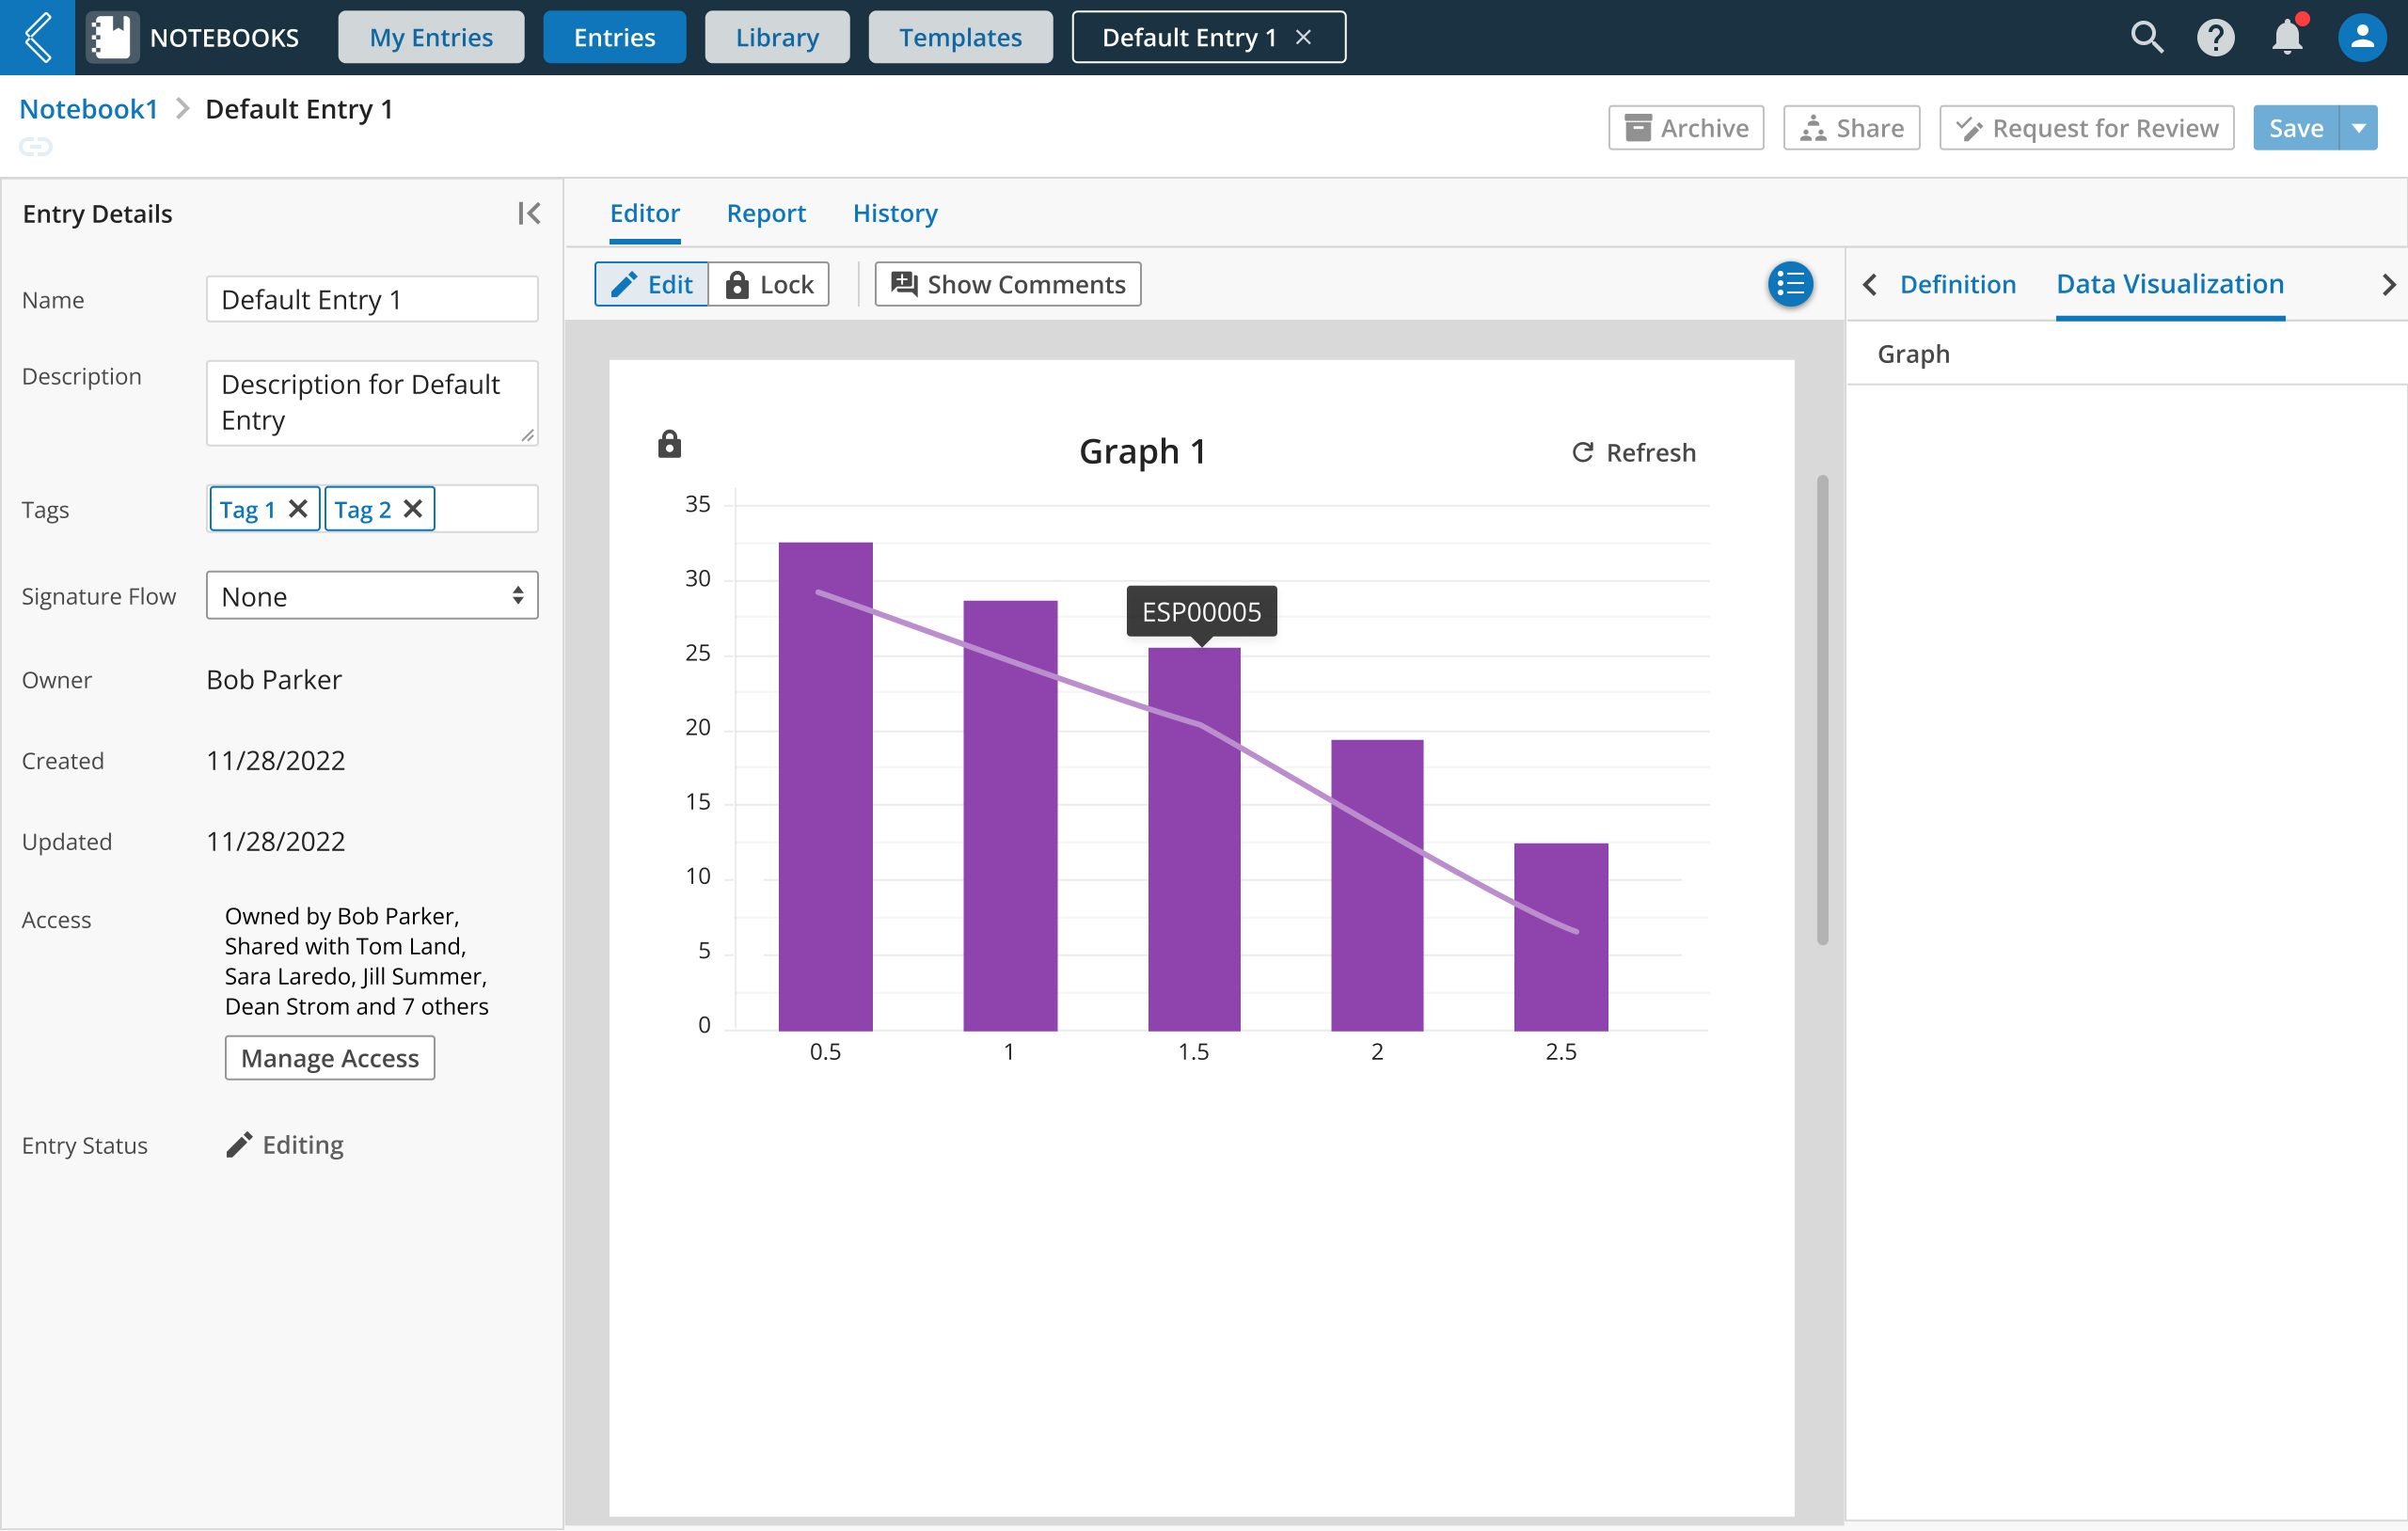
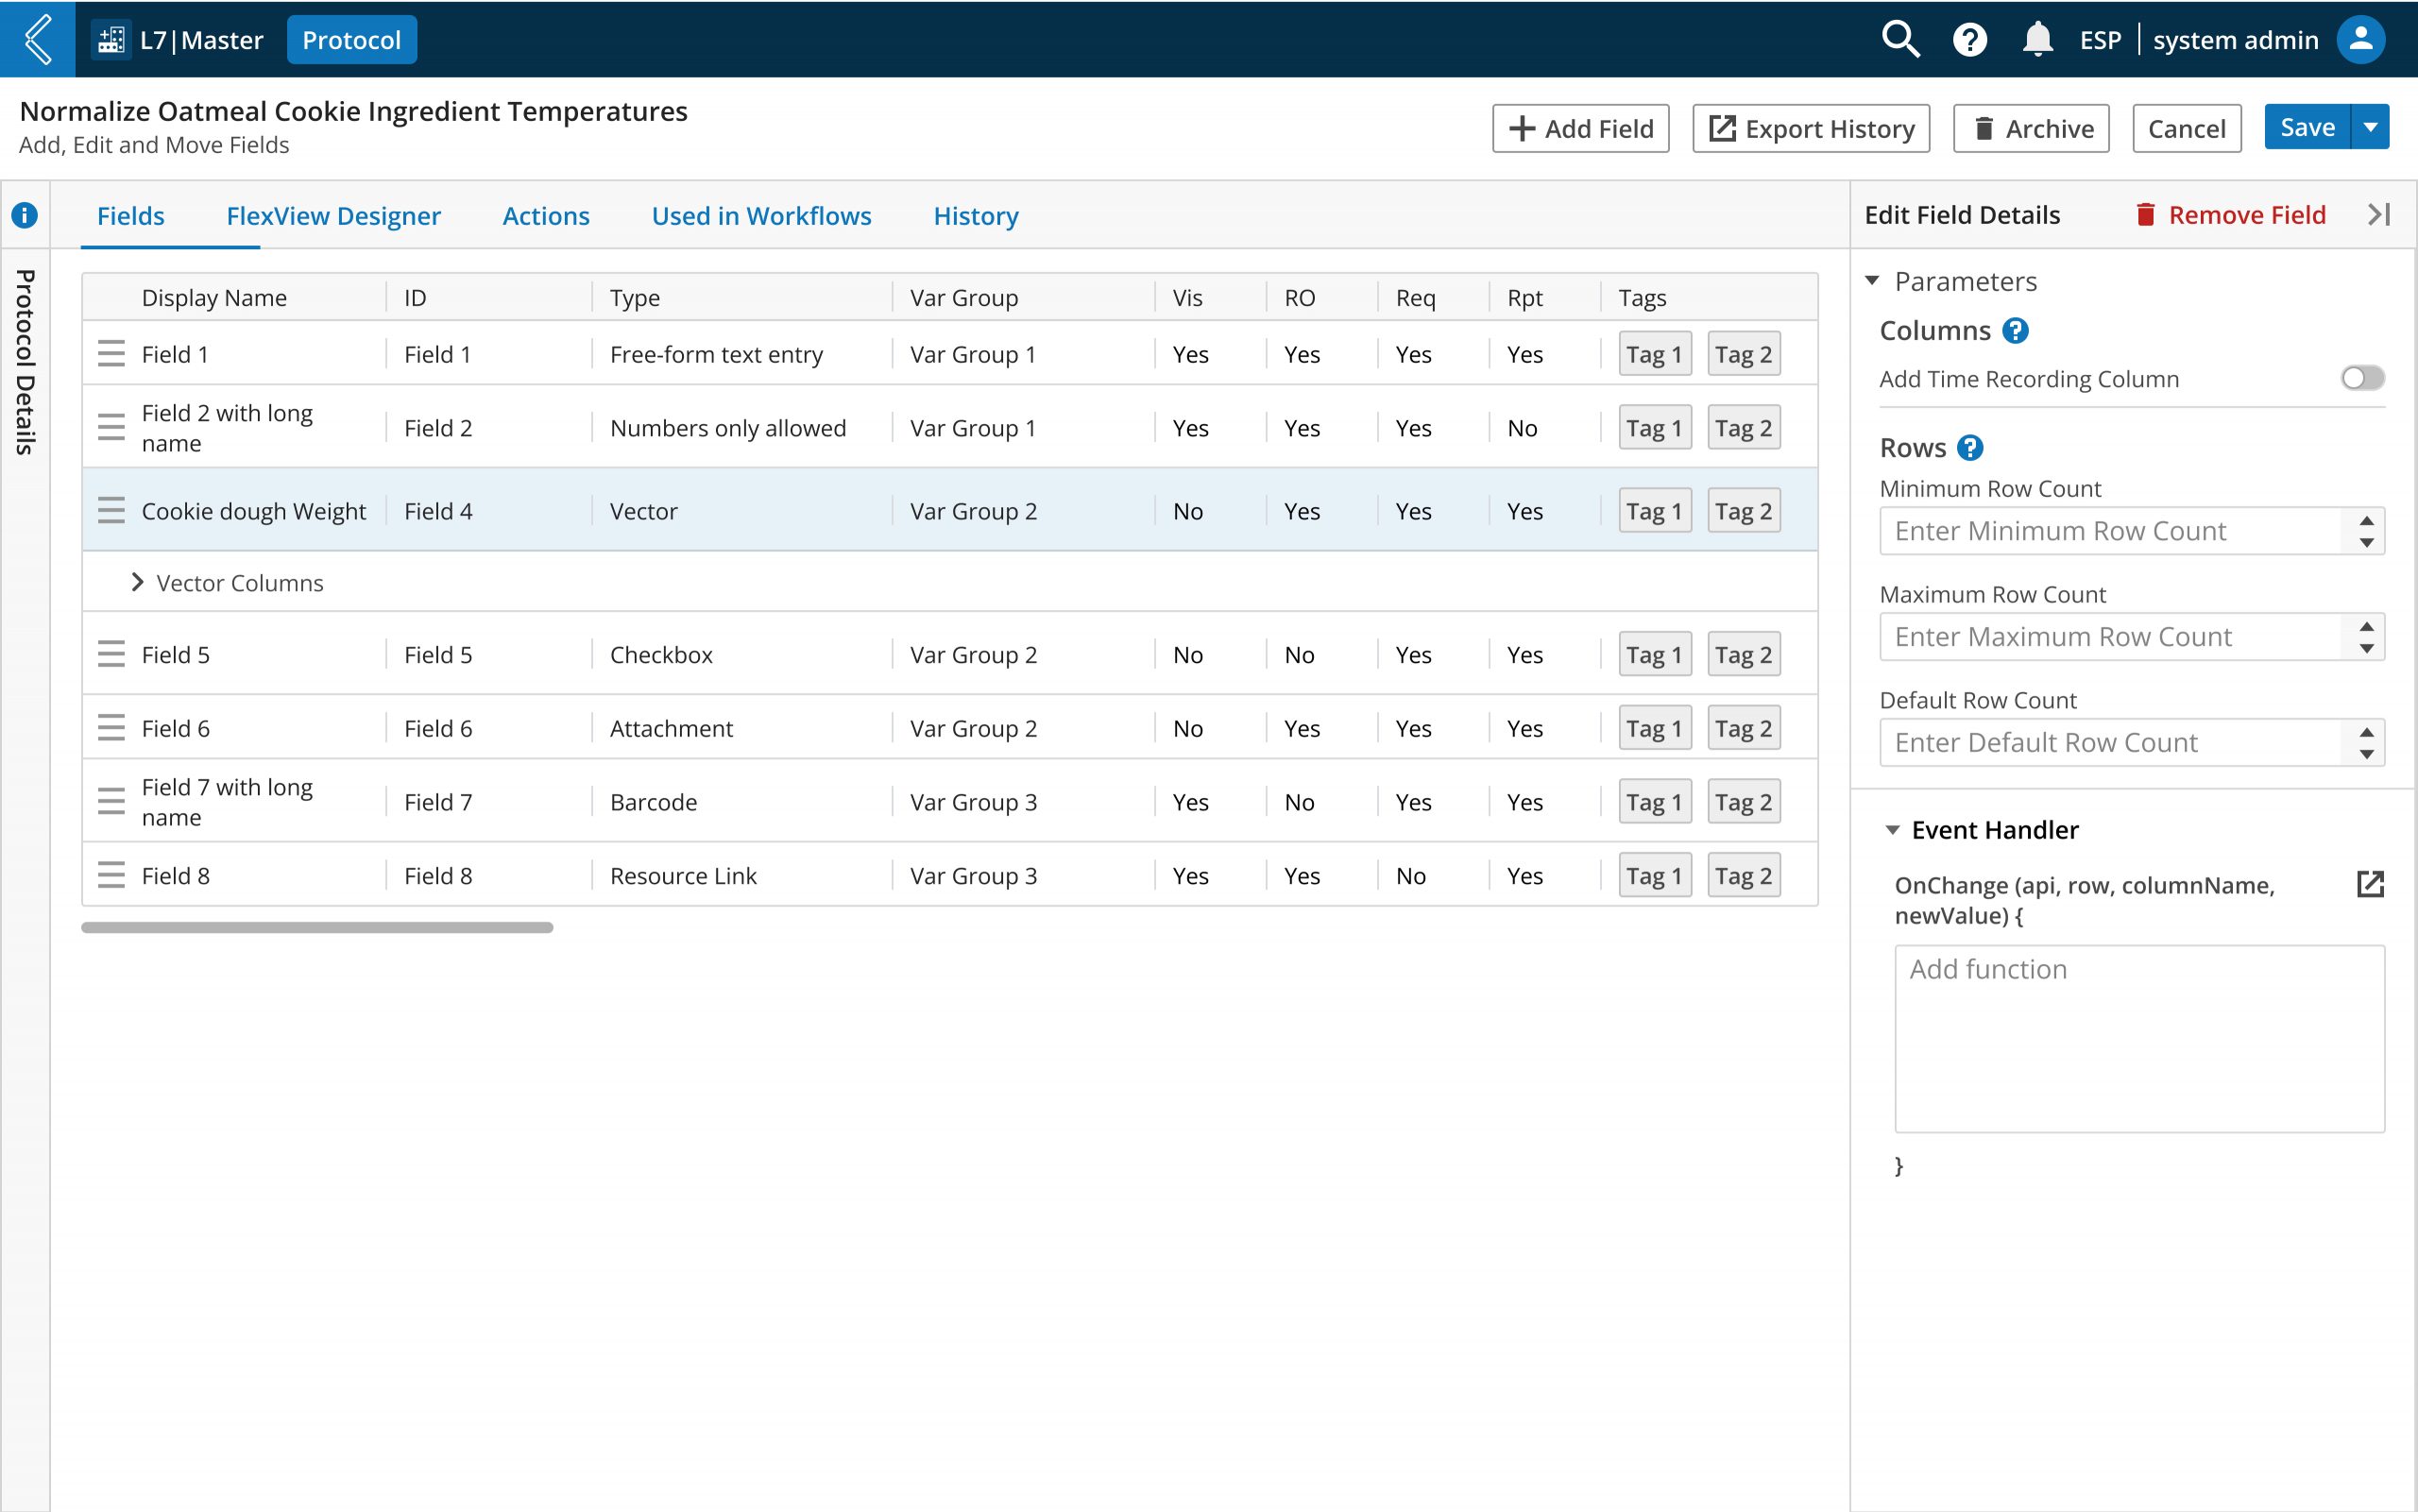
– Low Code Data Modeling/ Data Visualization
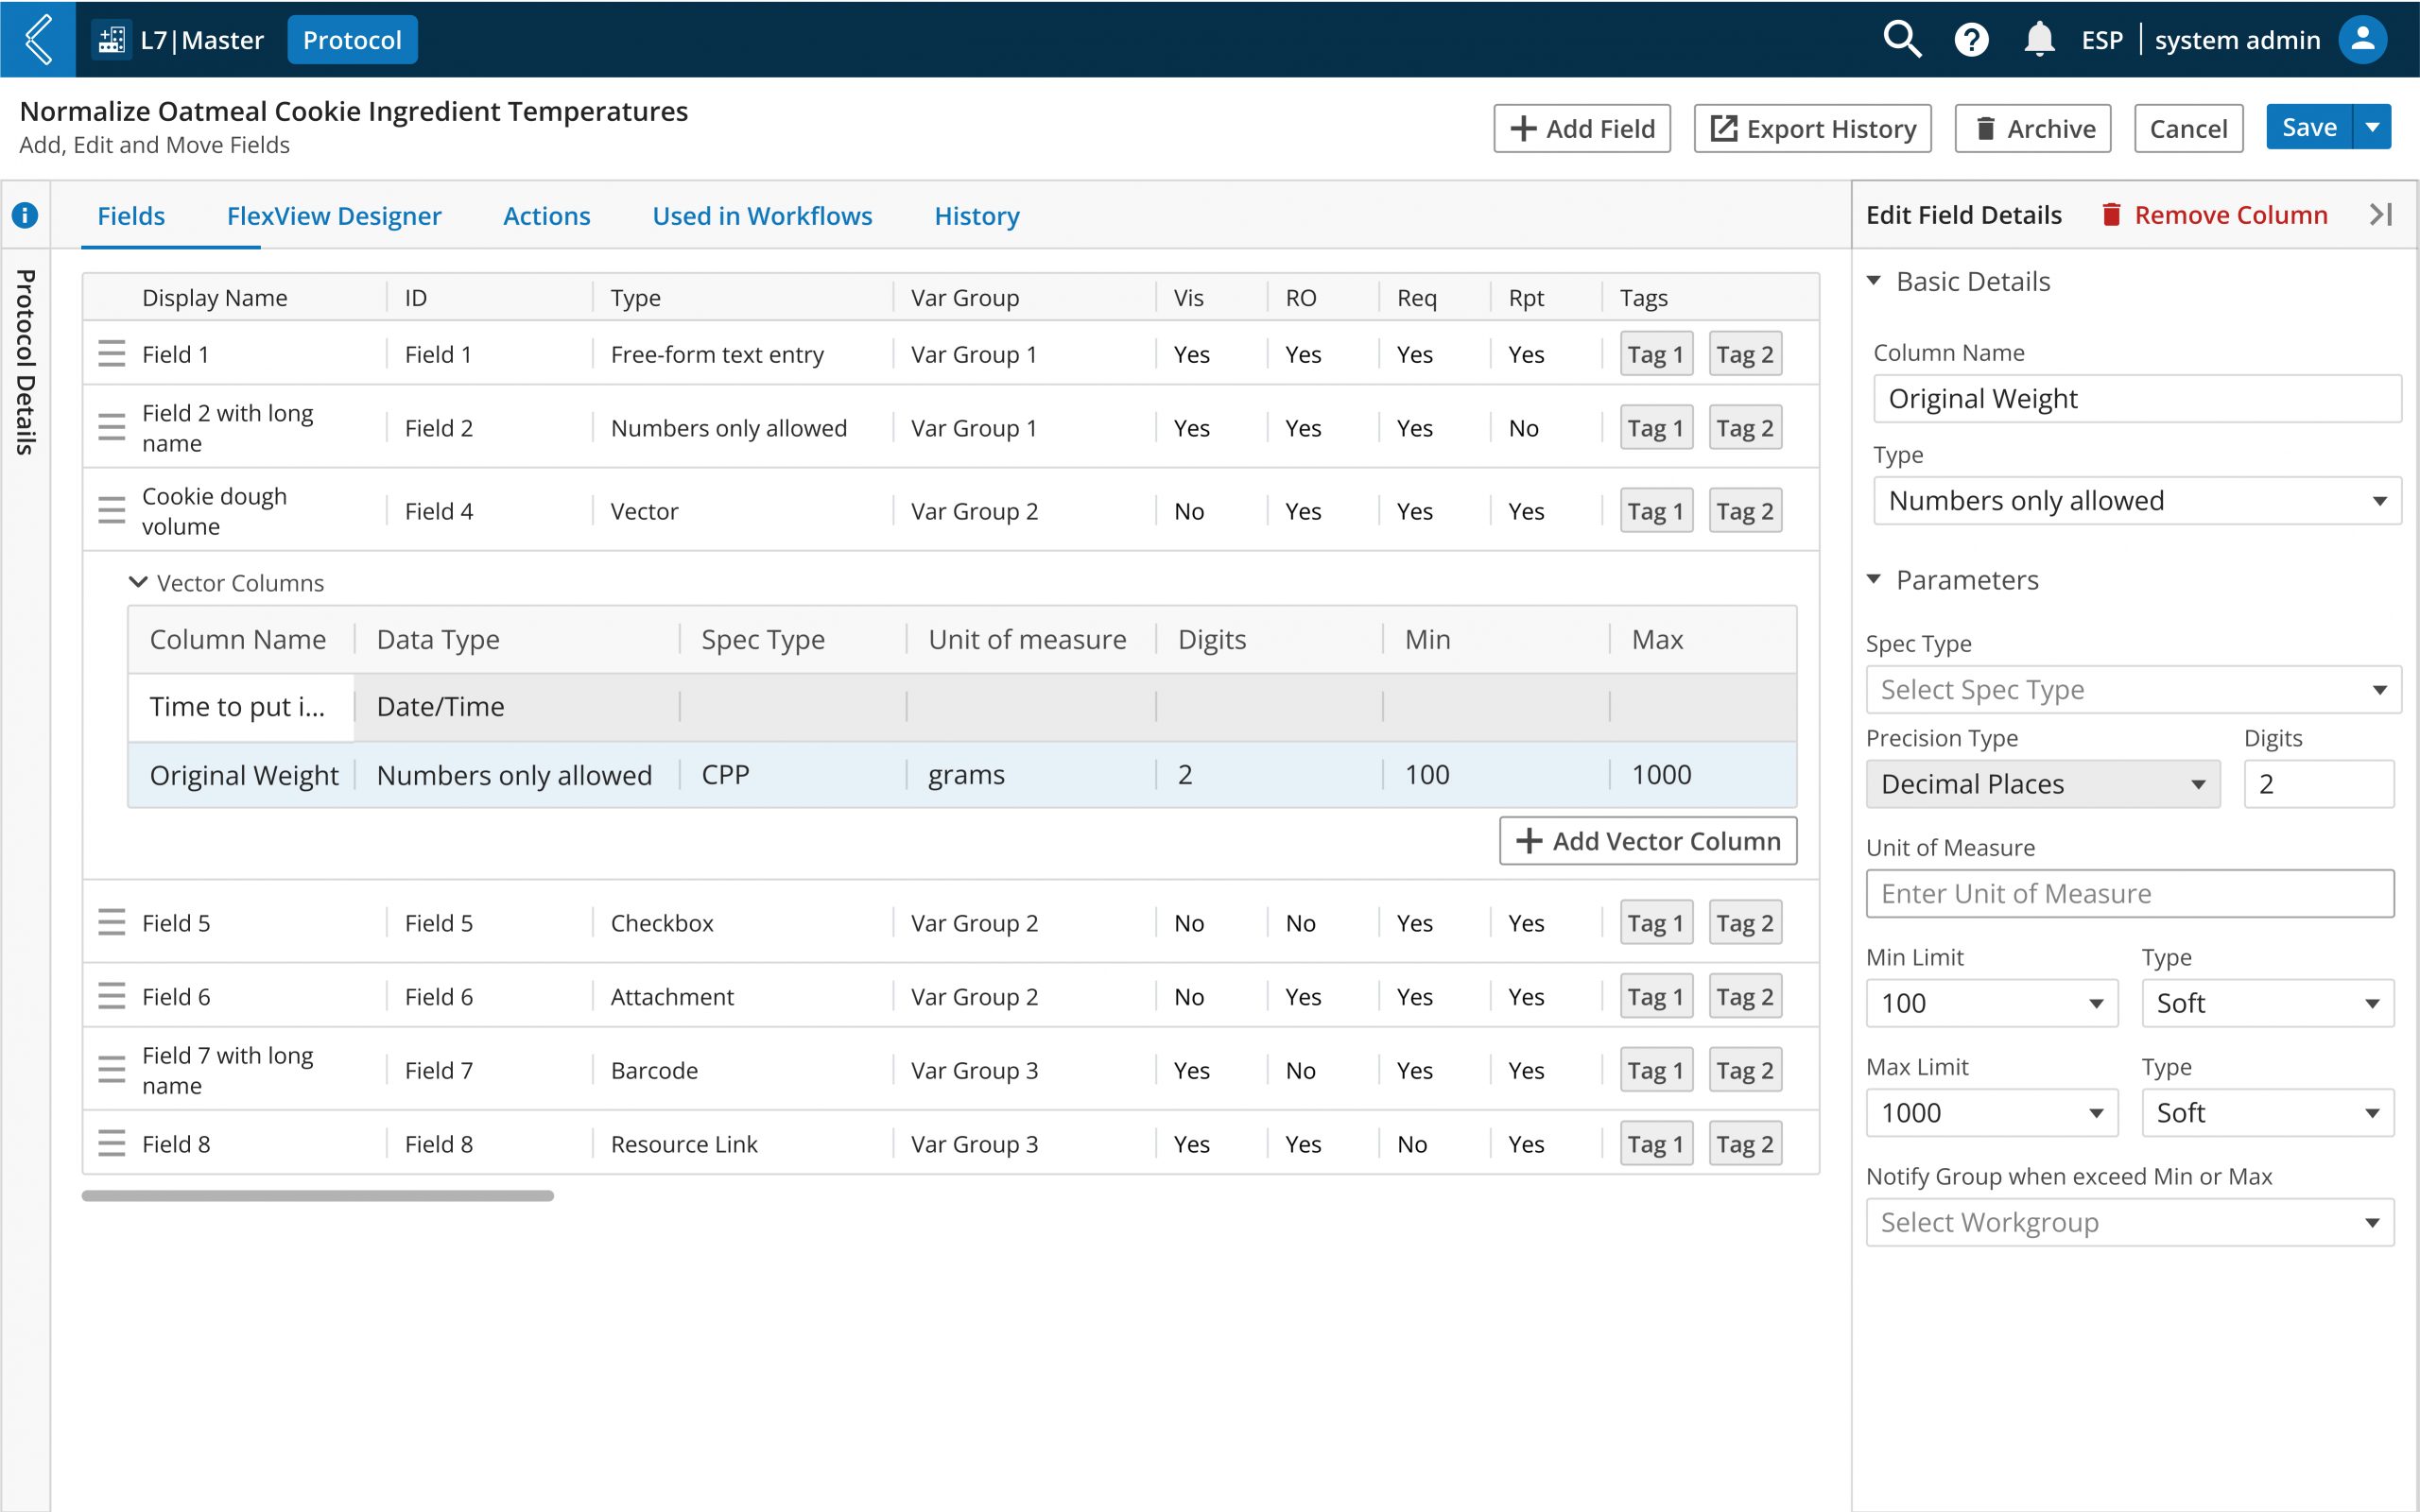
Easy form like interface to design or visualize data enables faster implementation, less error and makes ESP accessible to a broader audience including non-technical users, to model or visualize data without needing deep programming or database knowledge.
This is where I designed how users can configure vector tables to record the number of rows dynamically within the cell visually and visualize the experiment result in different types of graphs by selecting a couple of drop downs so scientists can focus on solving science problems not coding problems.
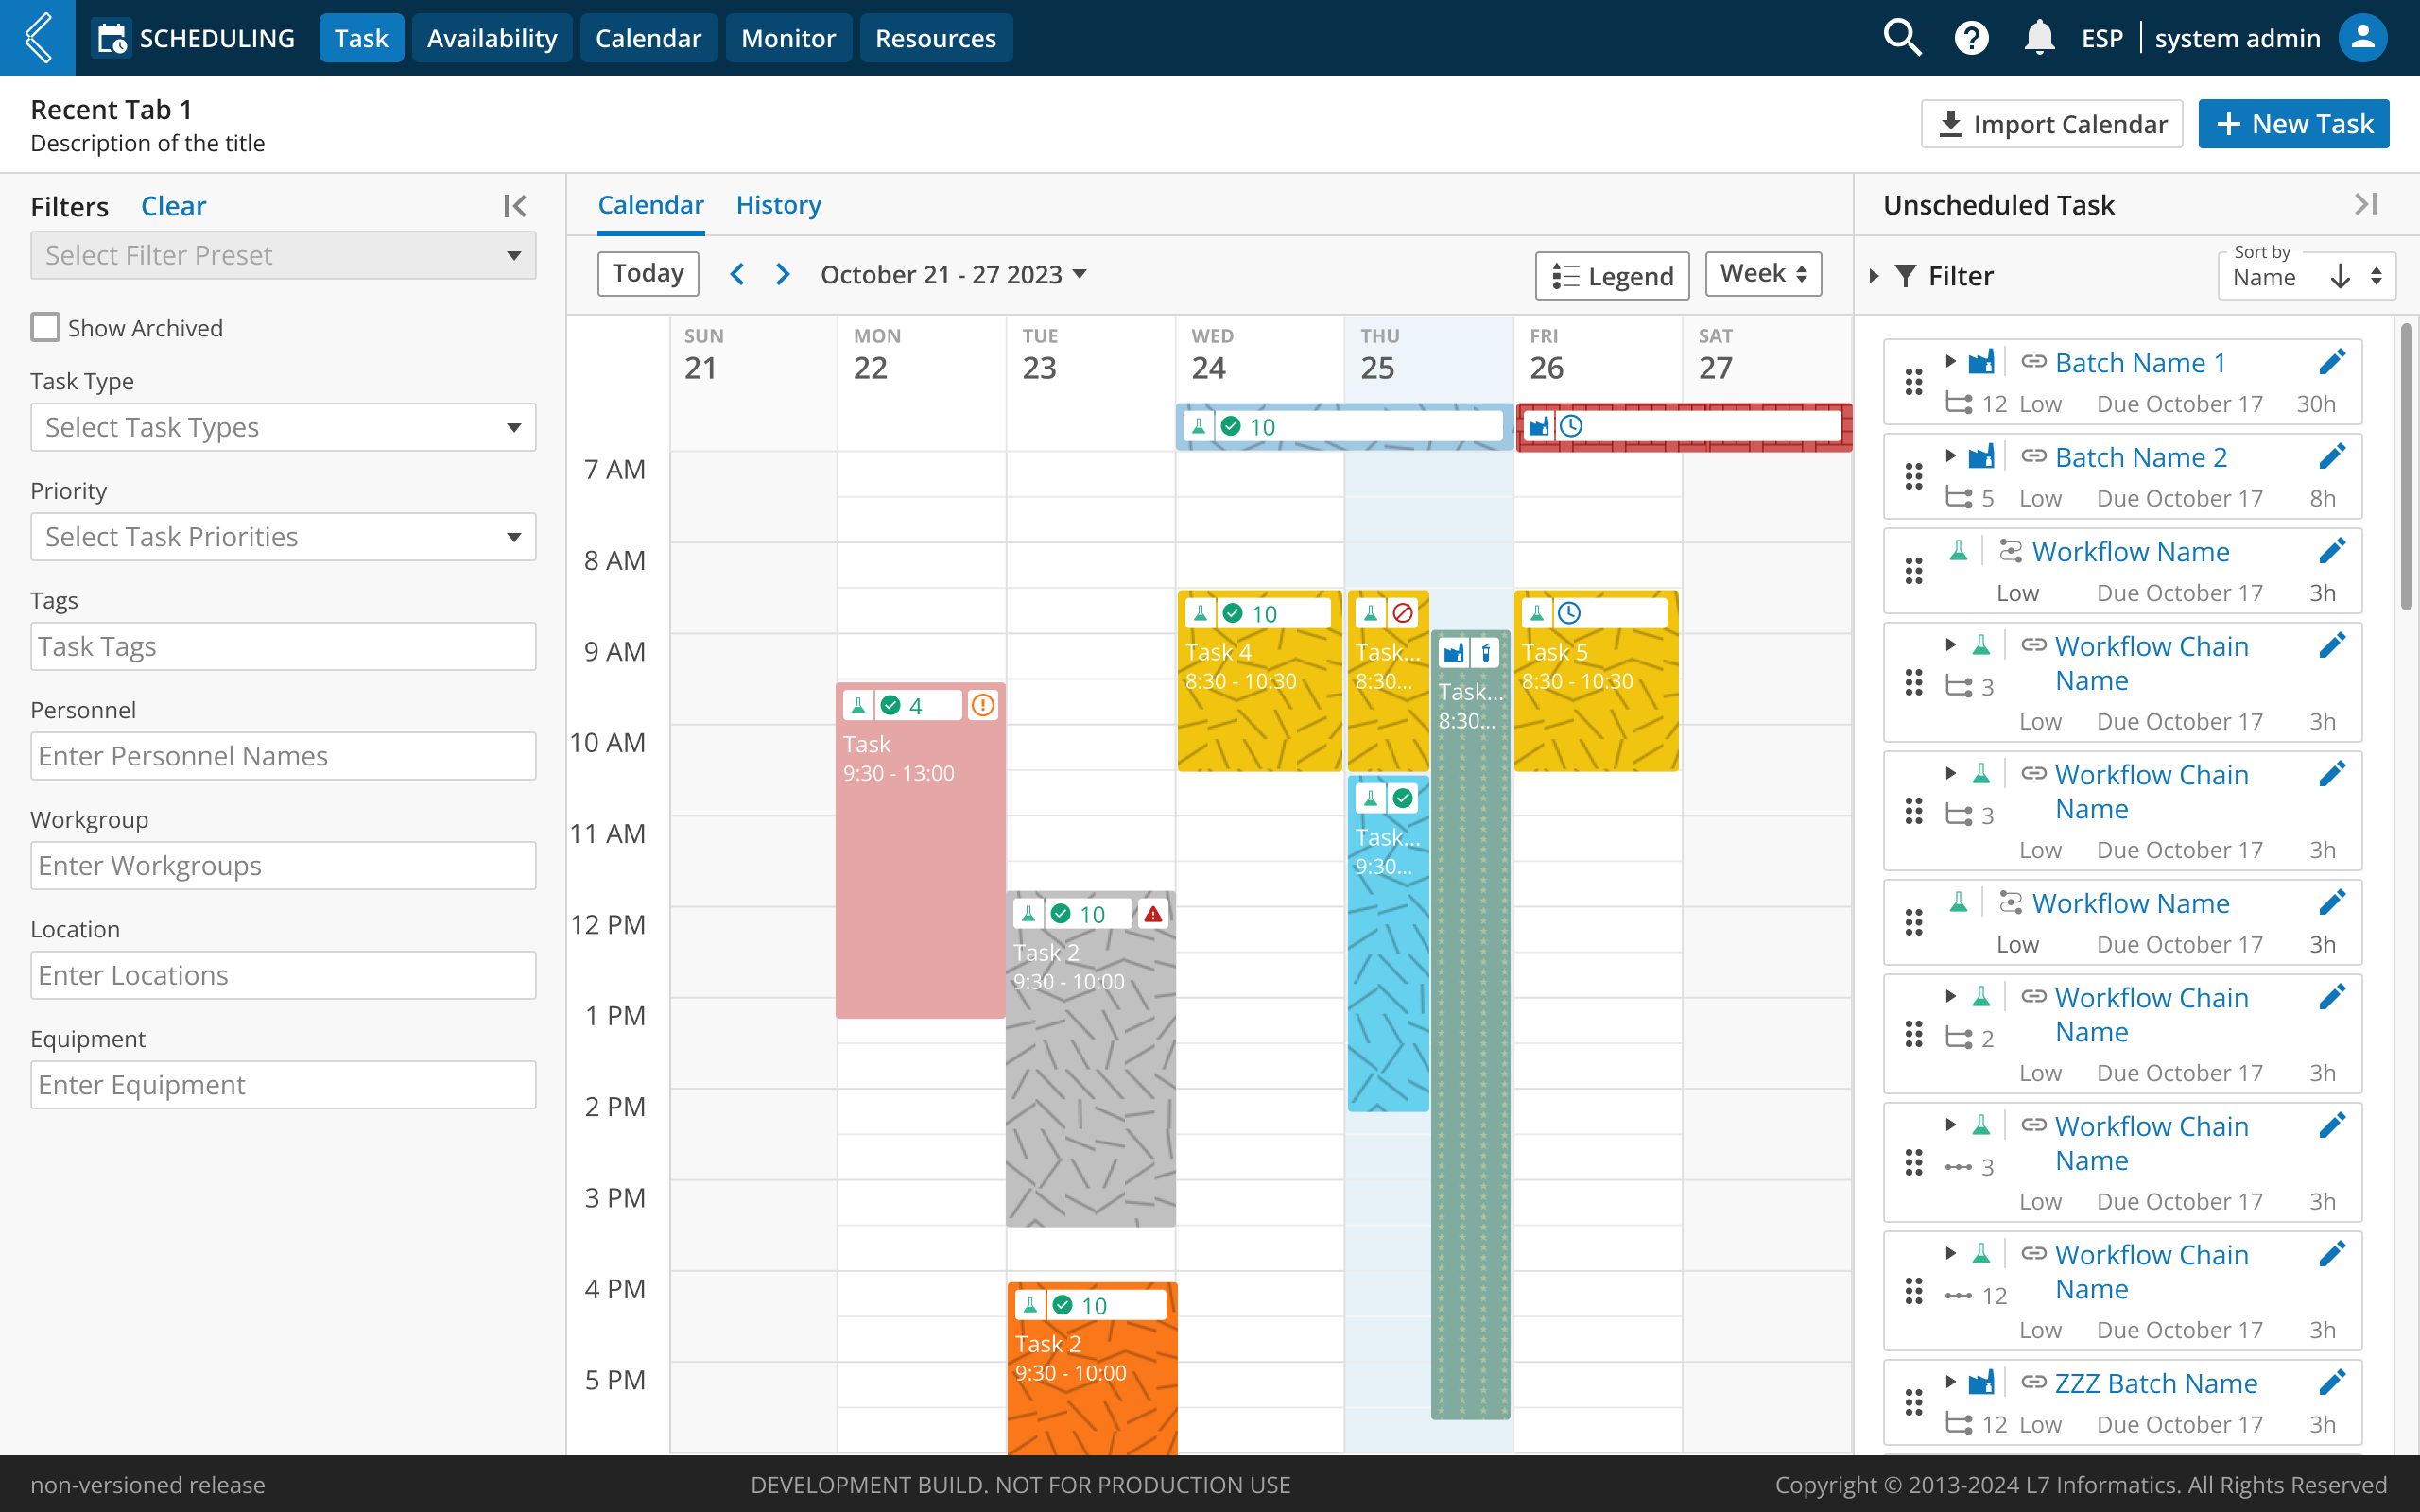
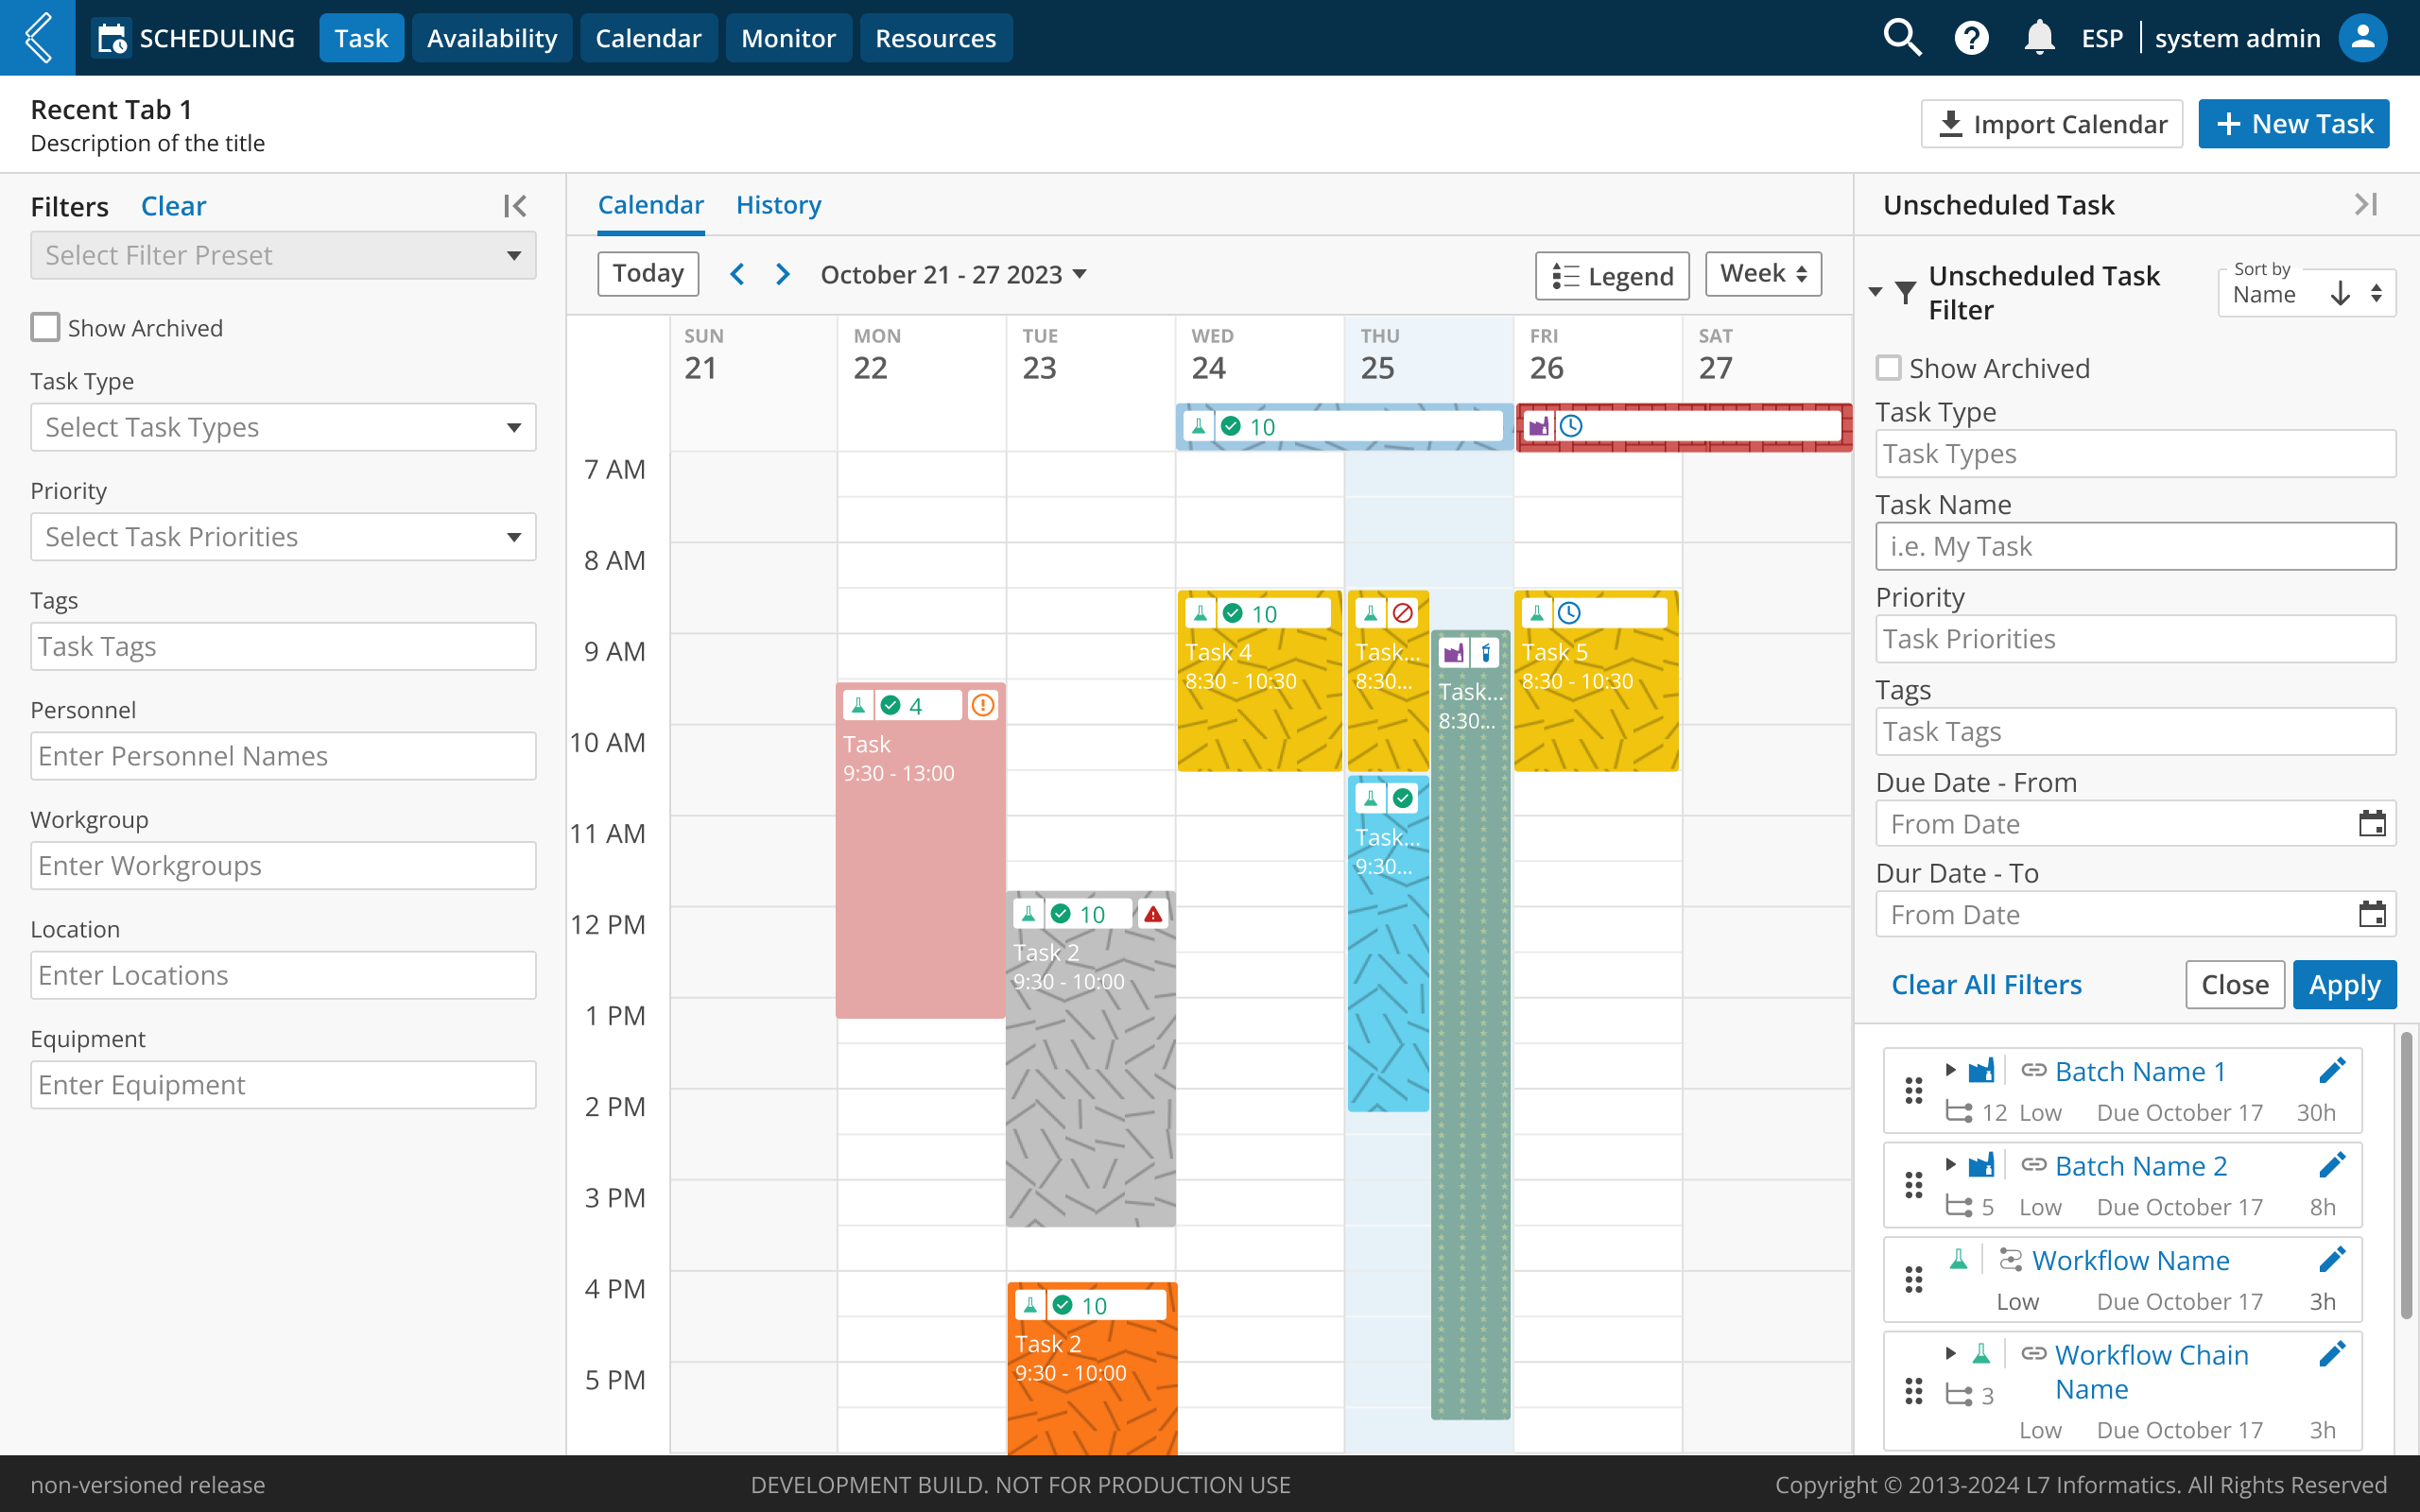
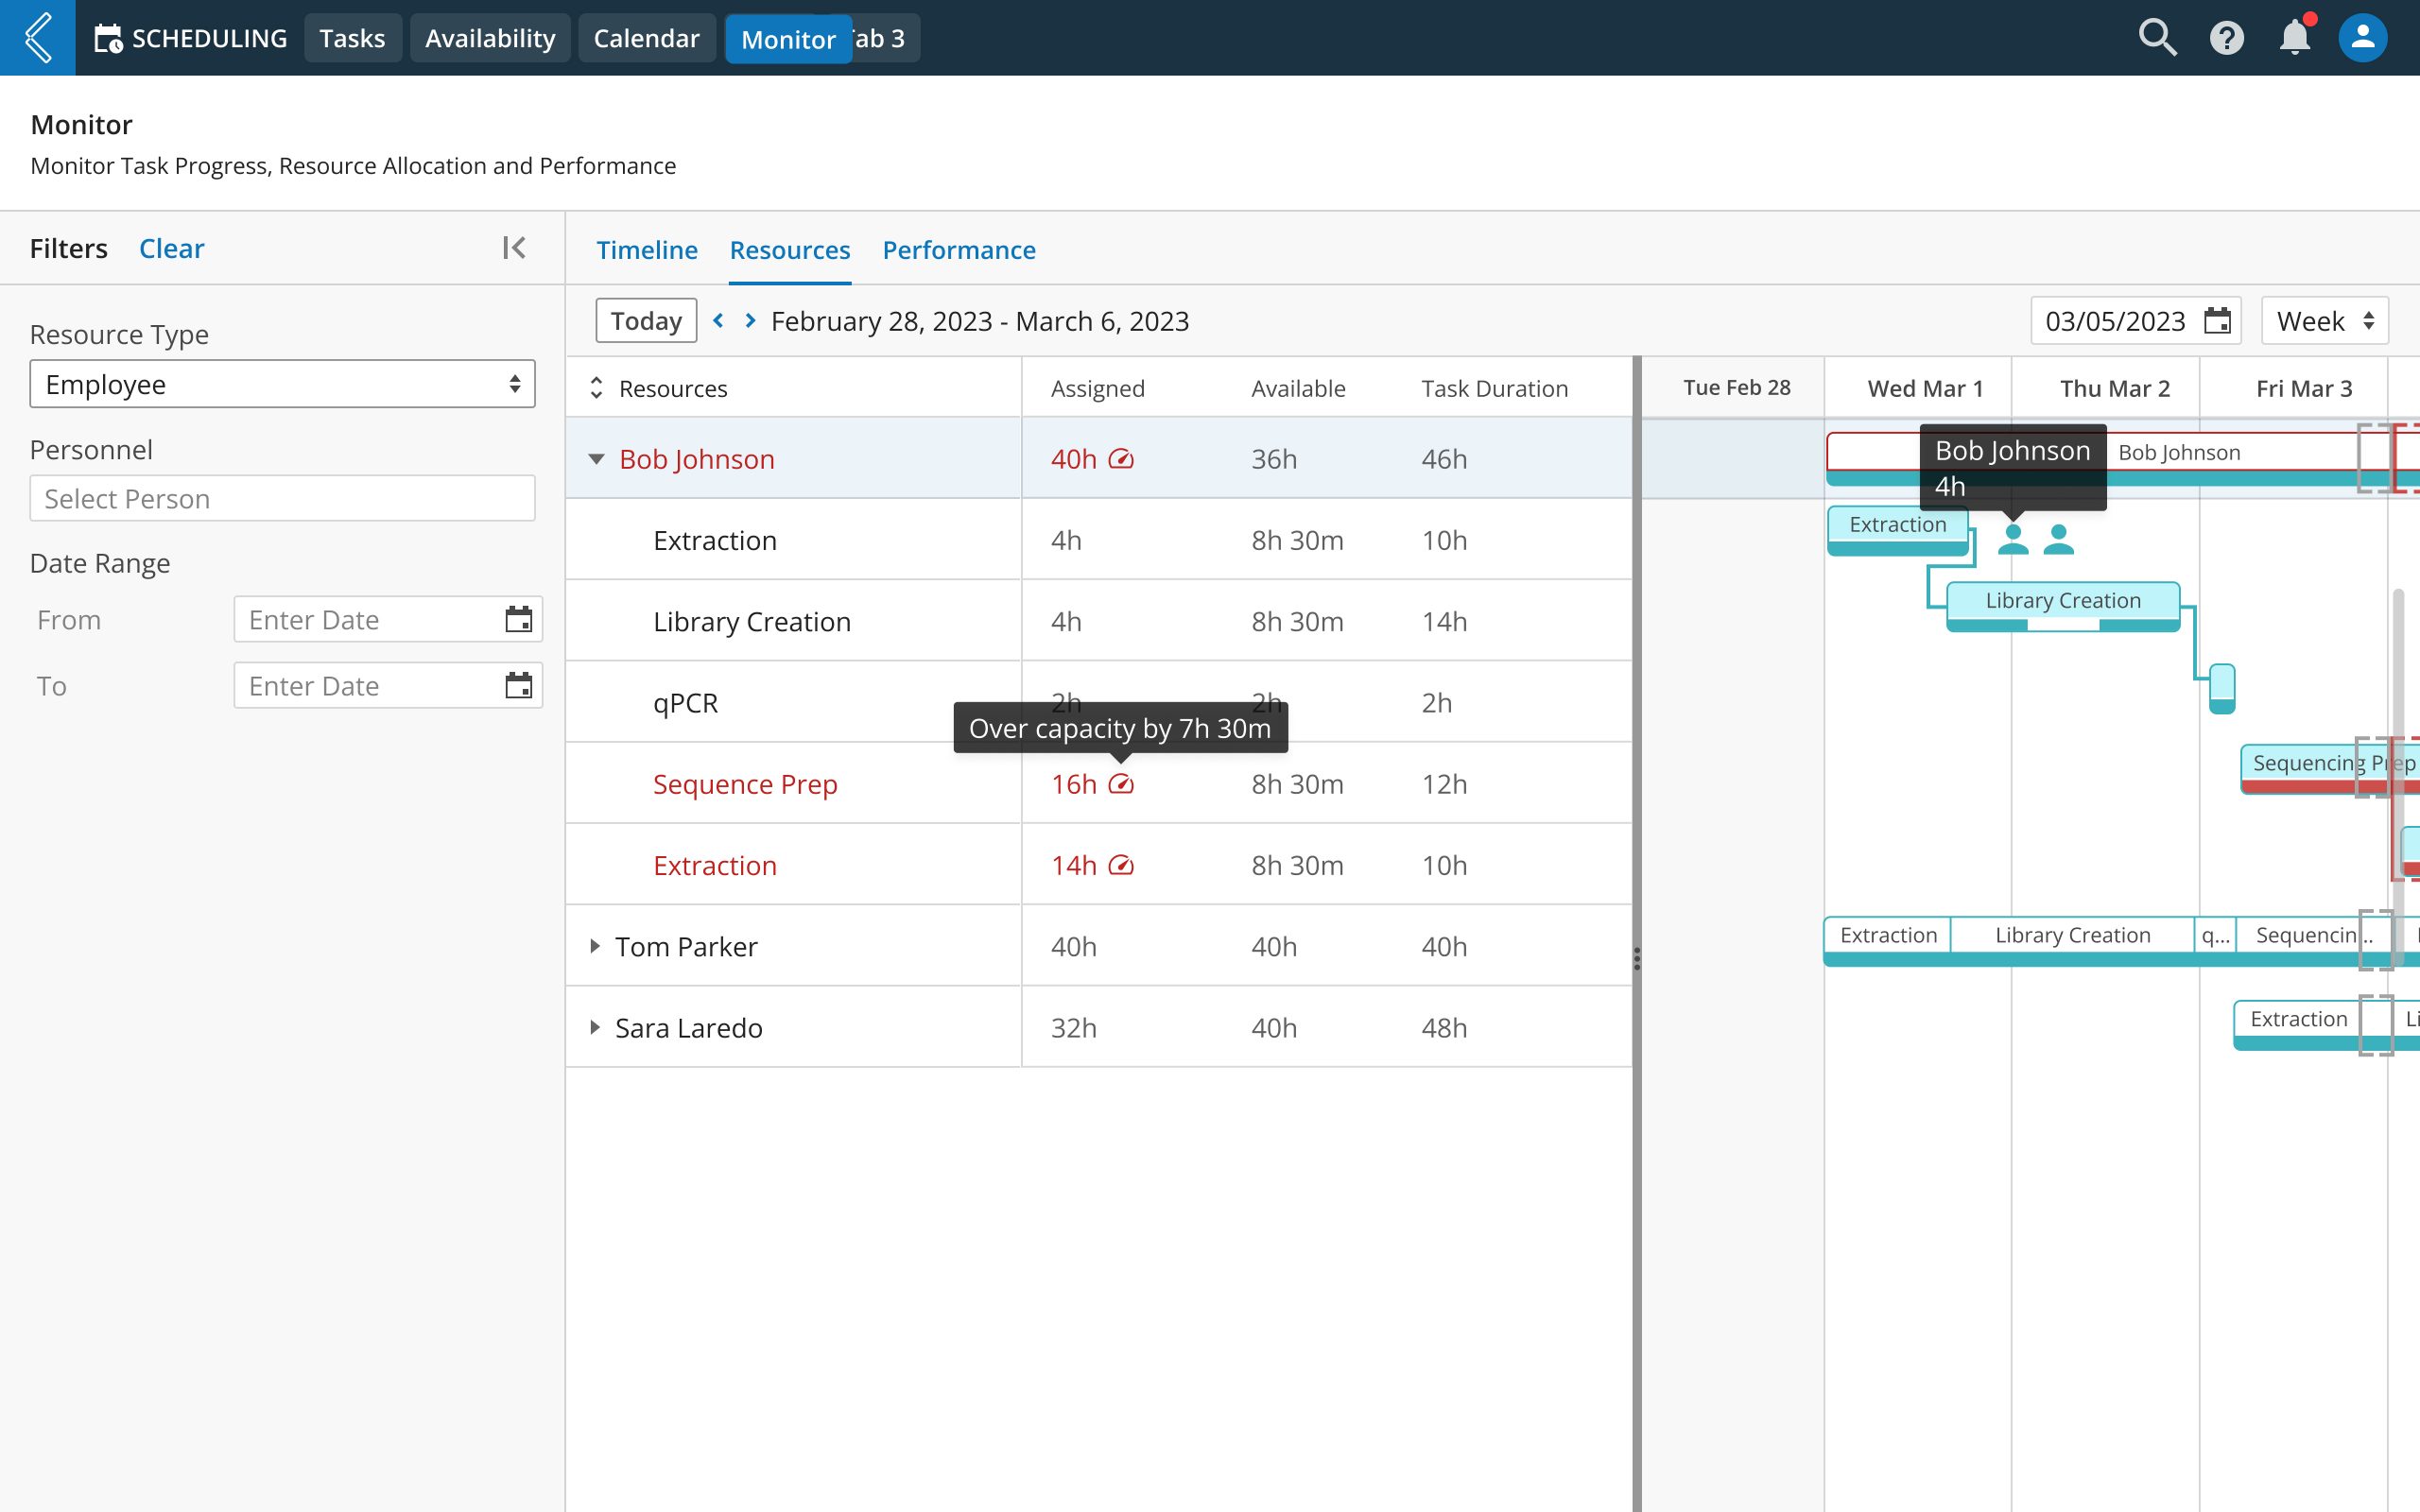
RESOURCE MANAGEMENT DESIGN
– Manage any type of assets across the globe
DESIGN FOR MOBILE DEVICE
– System on the Go
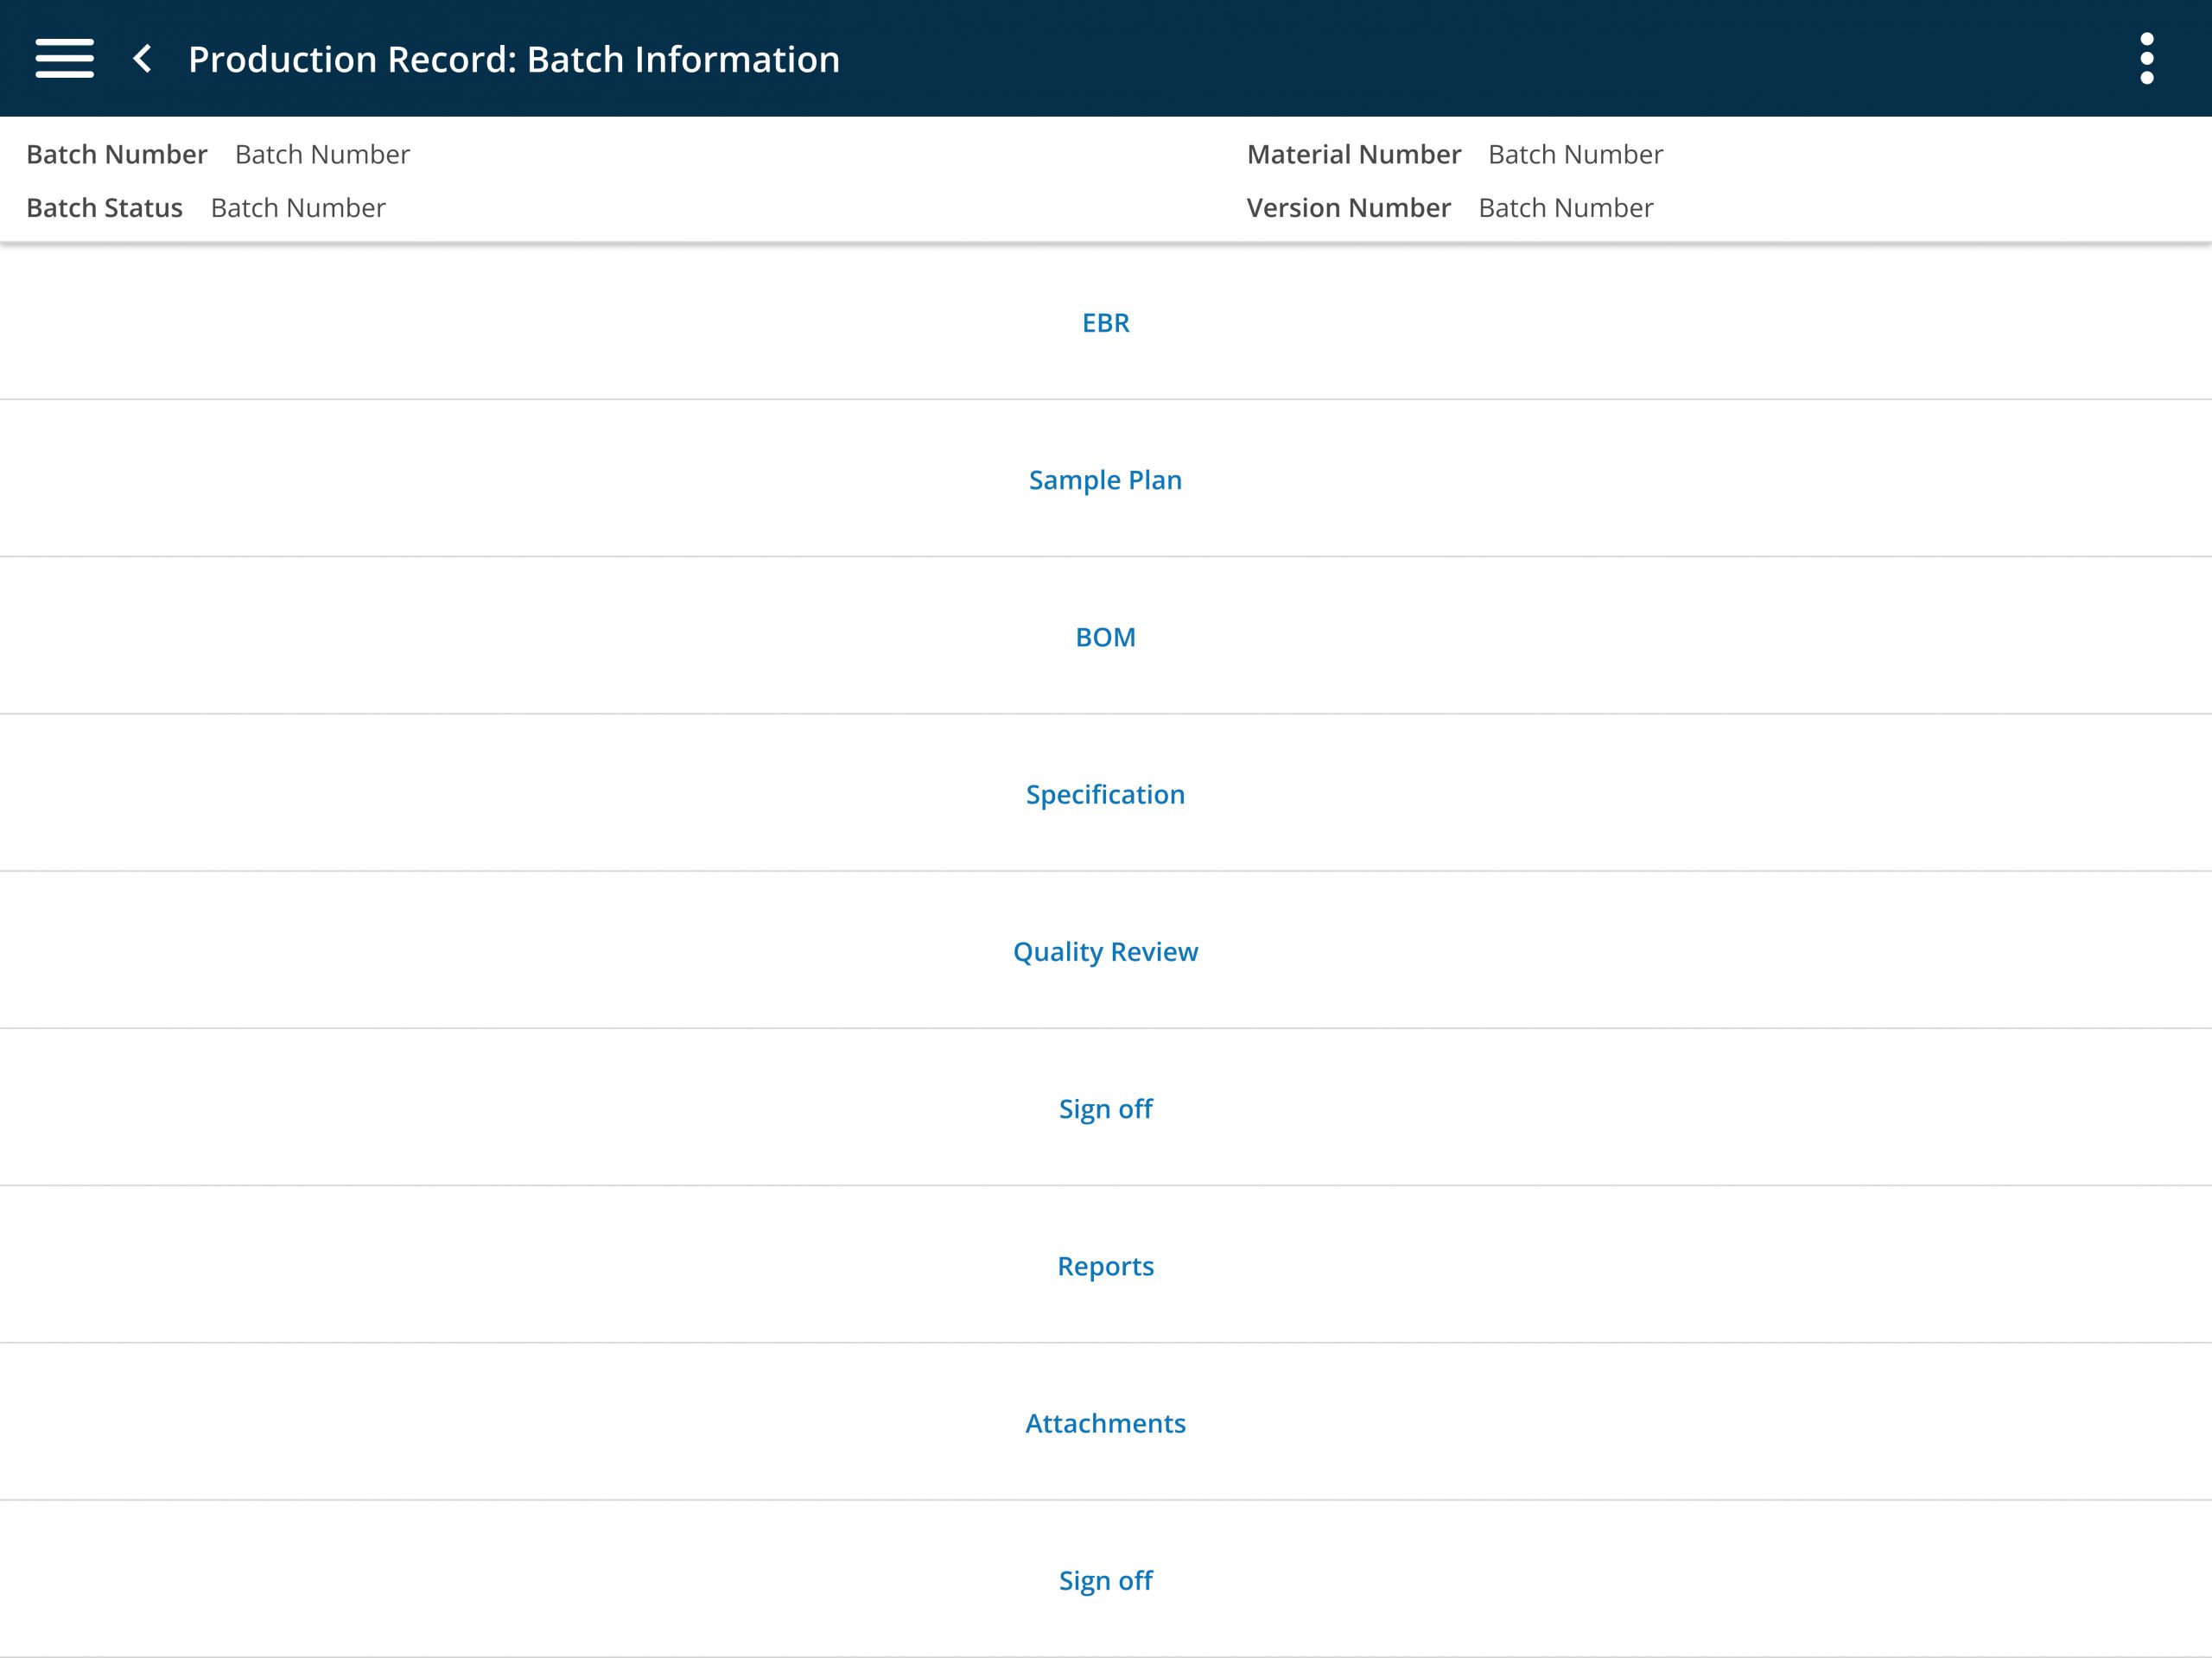
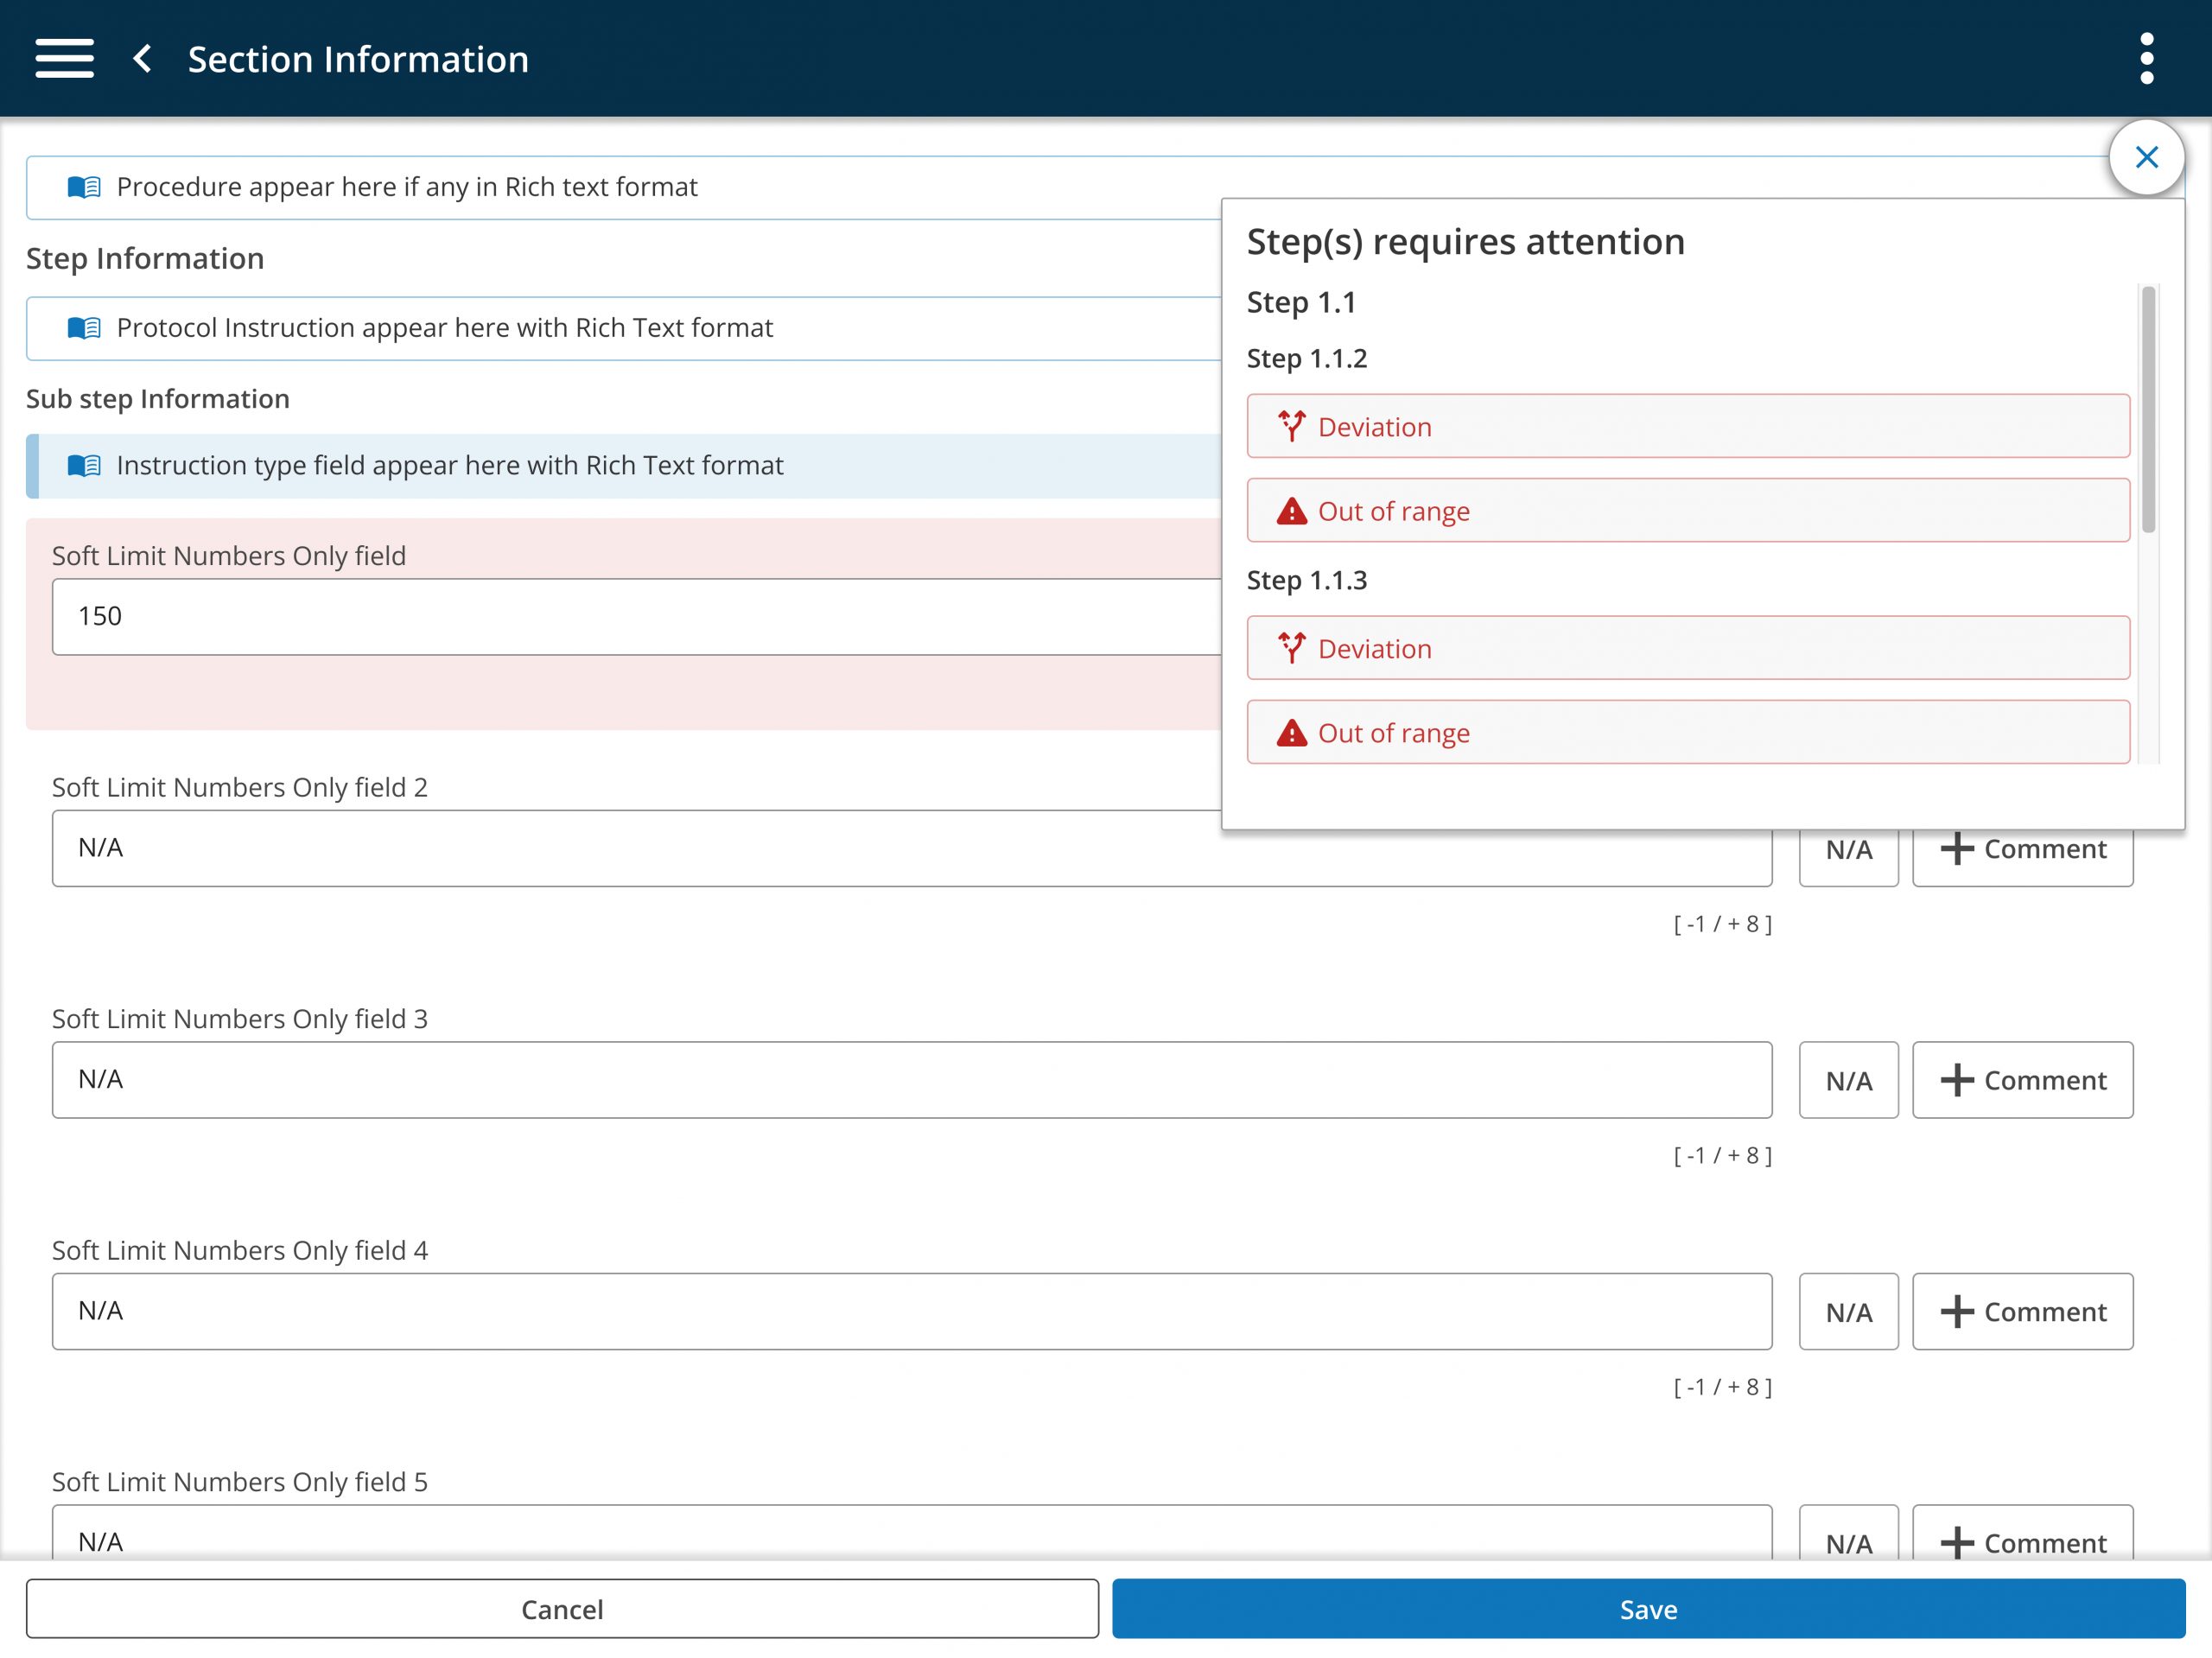
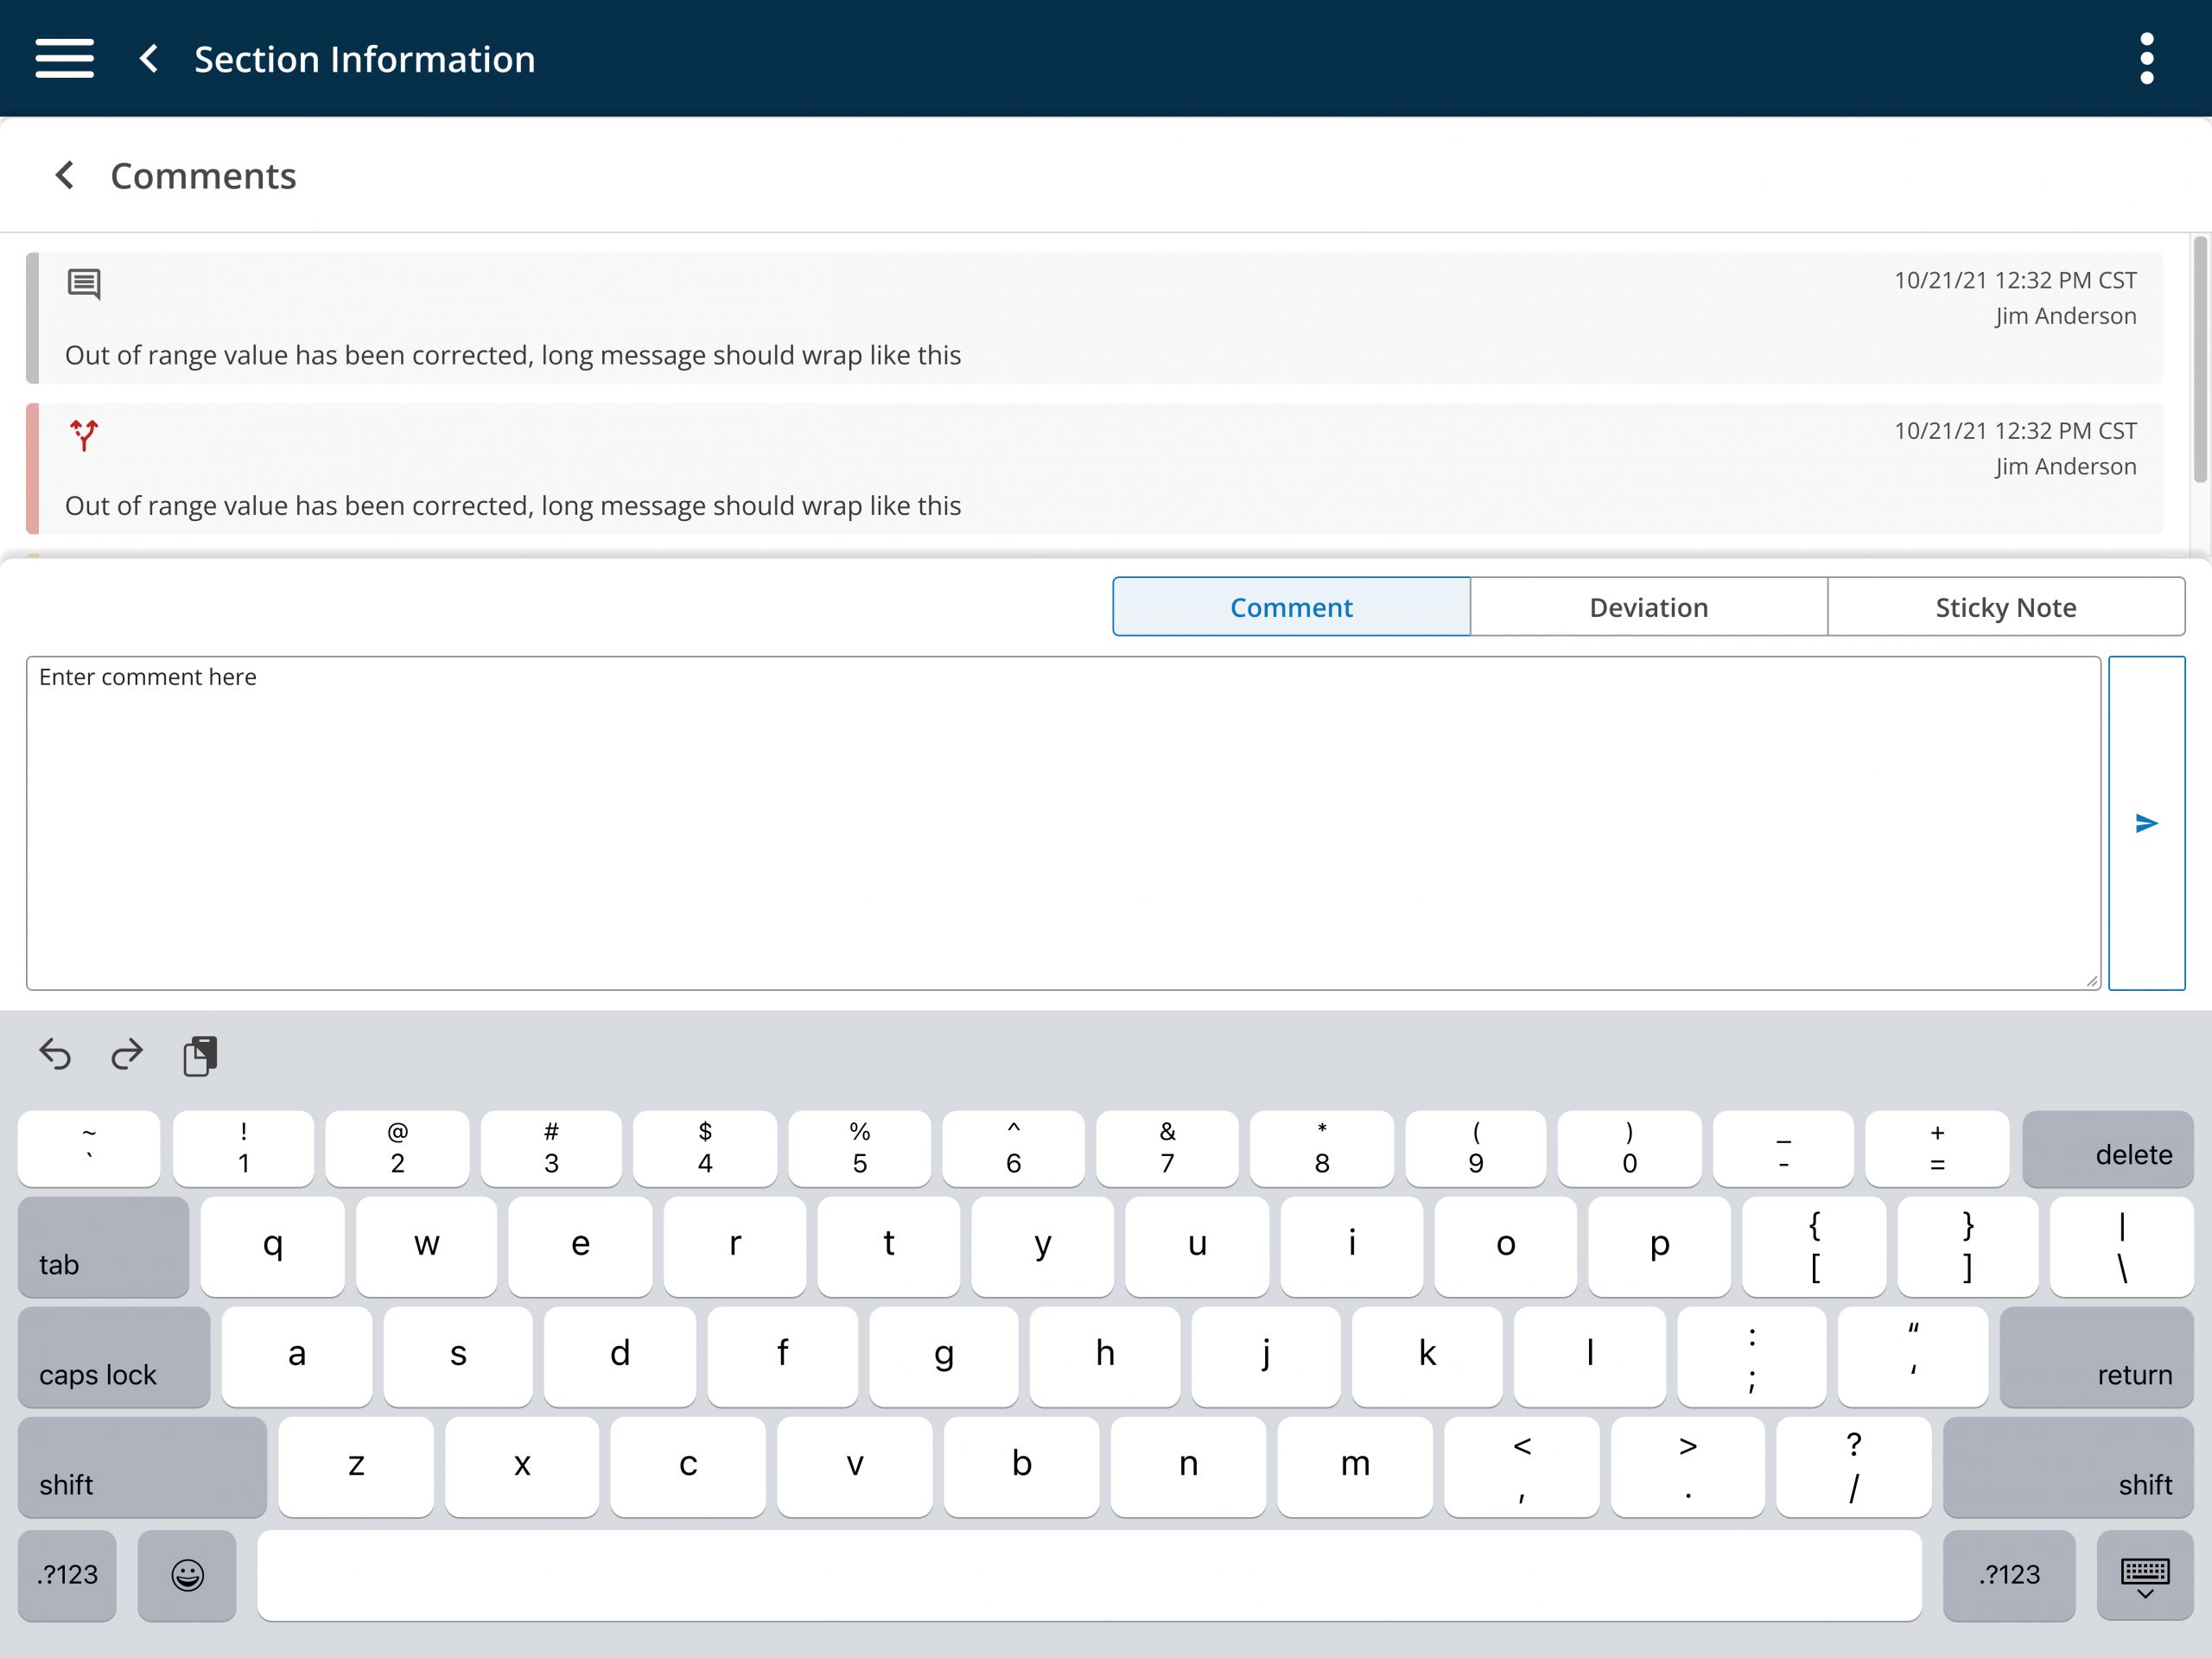
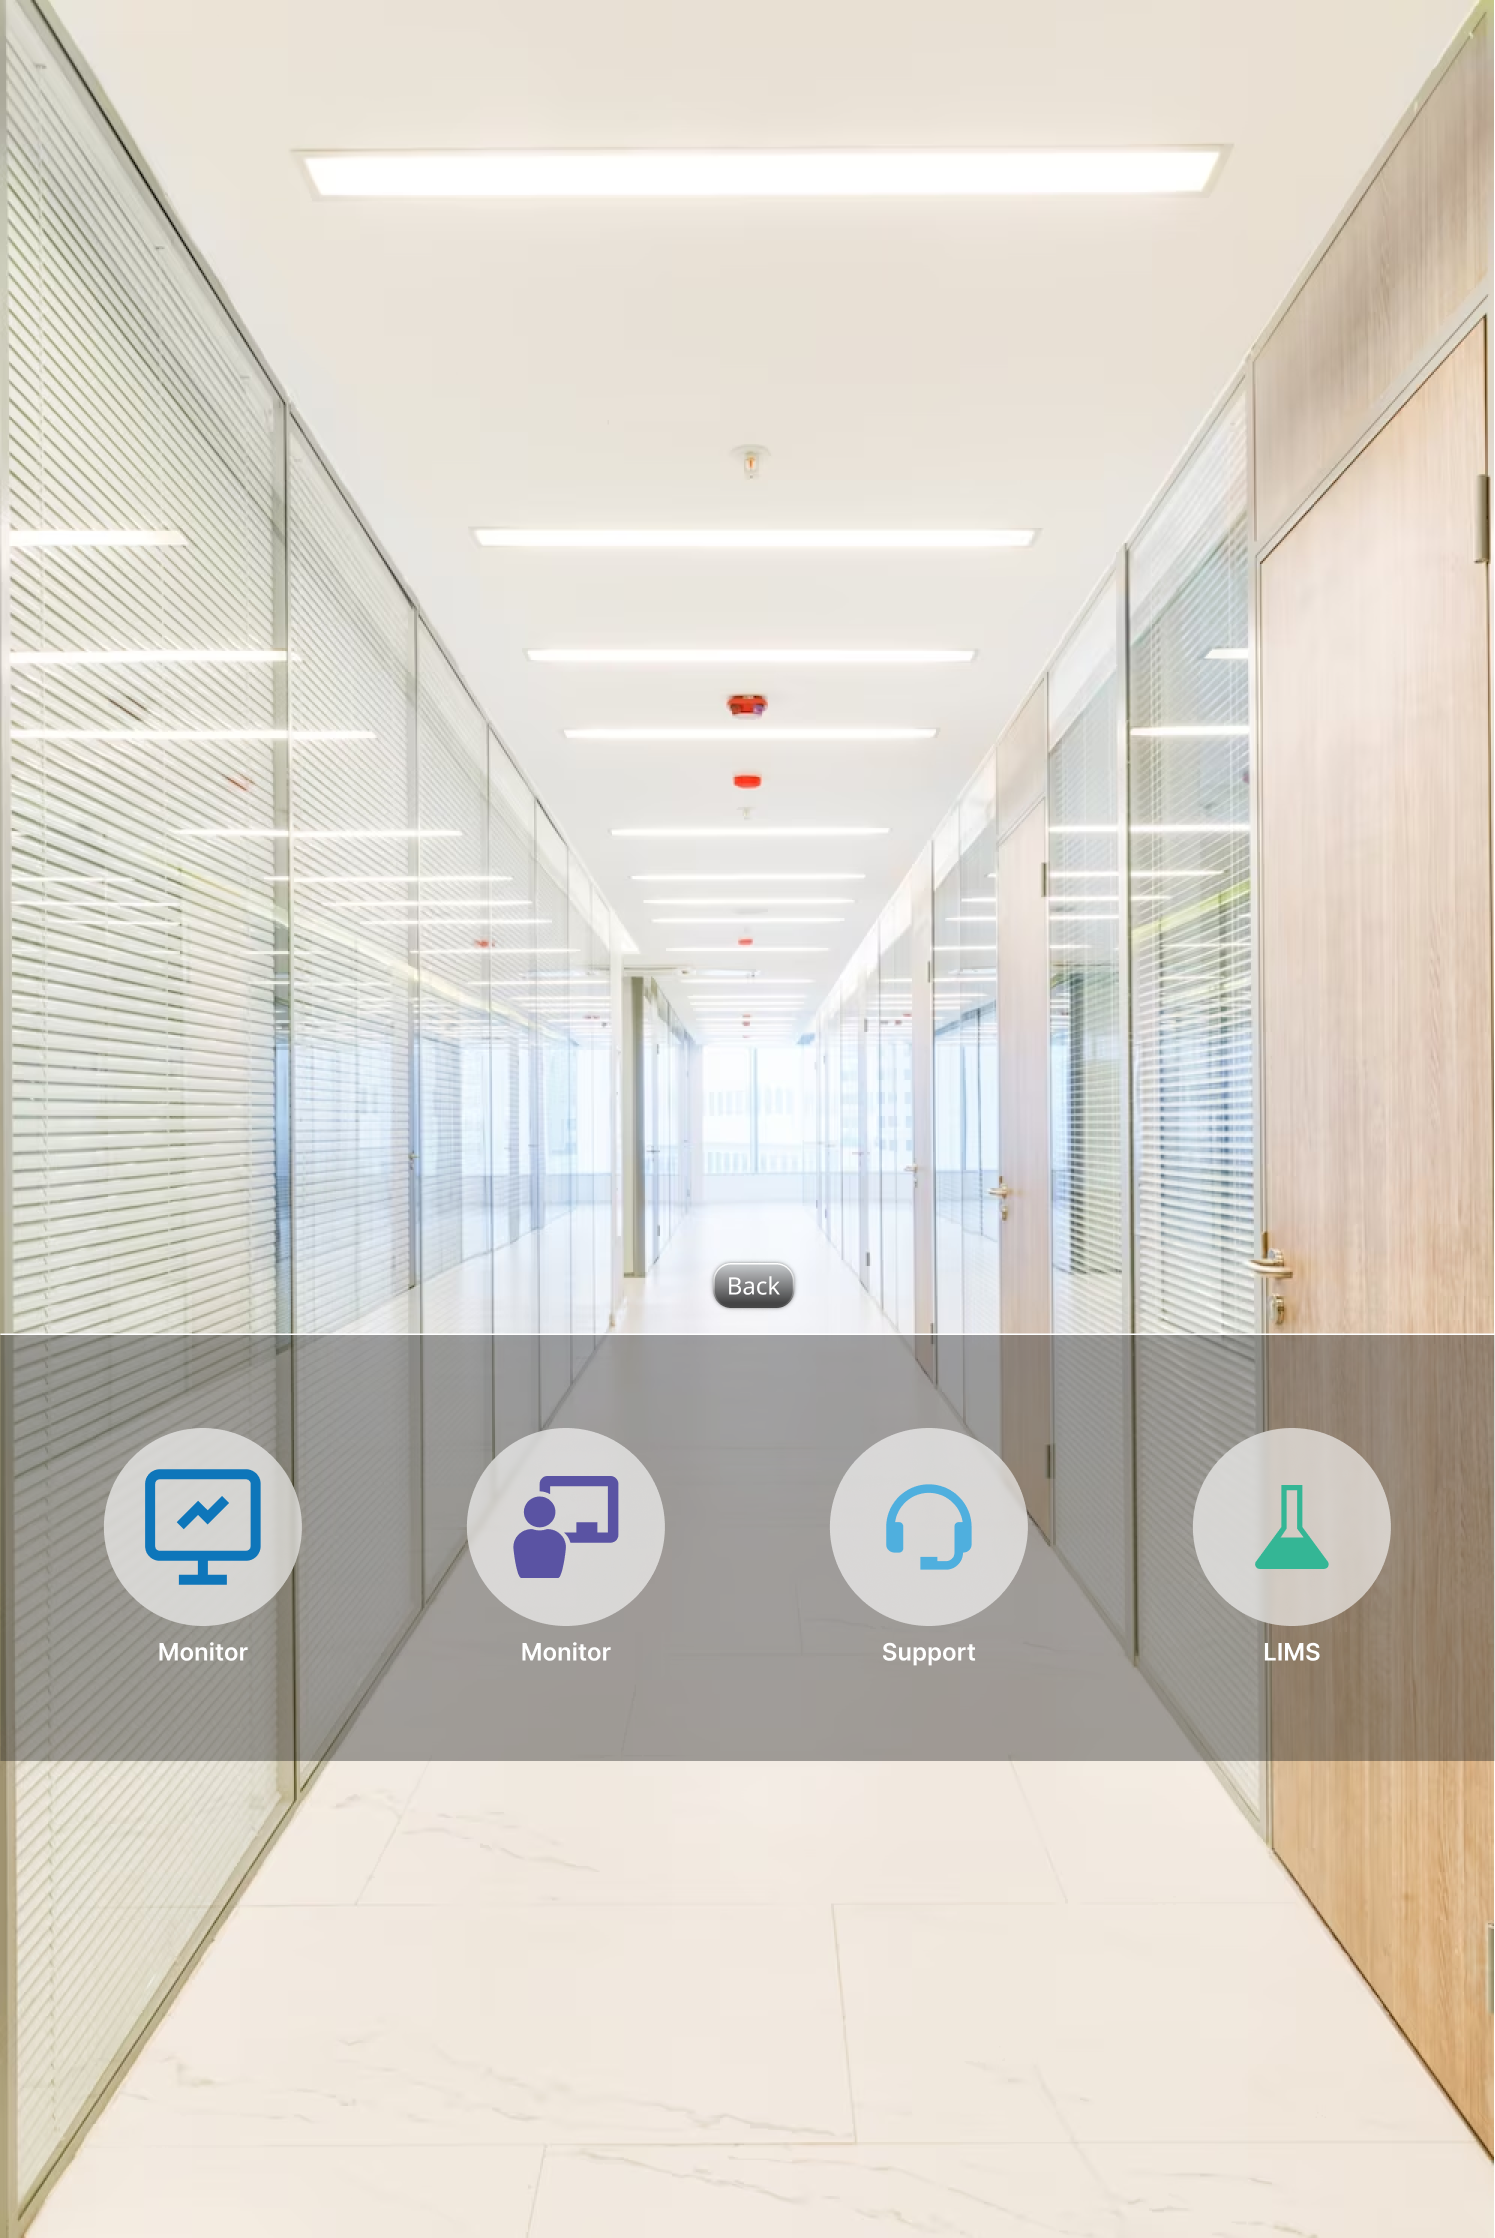
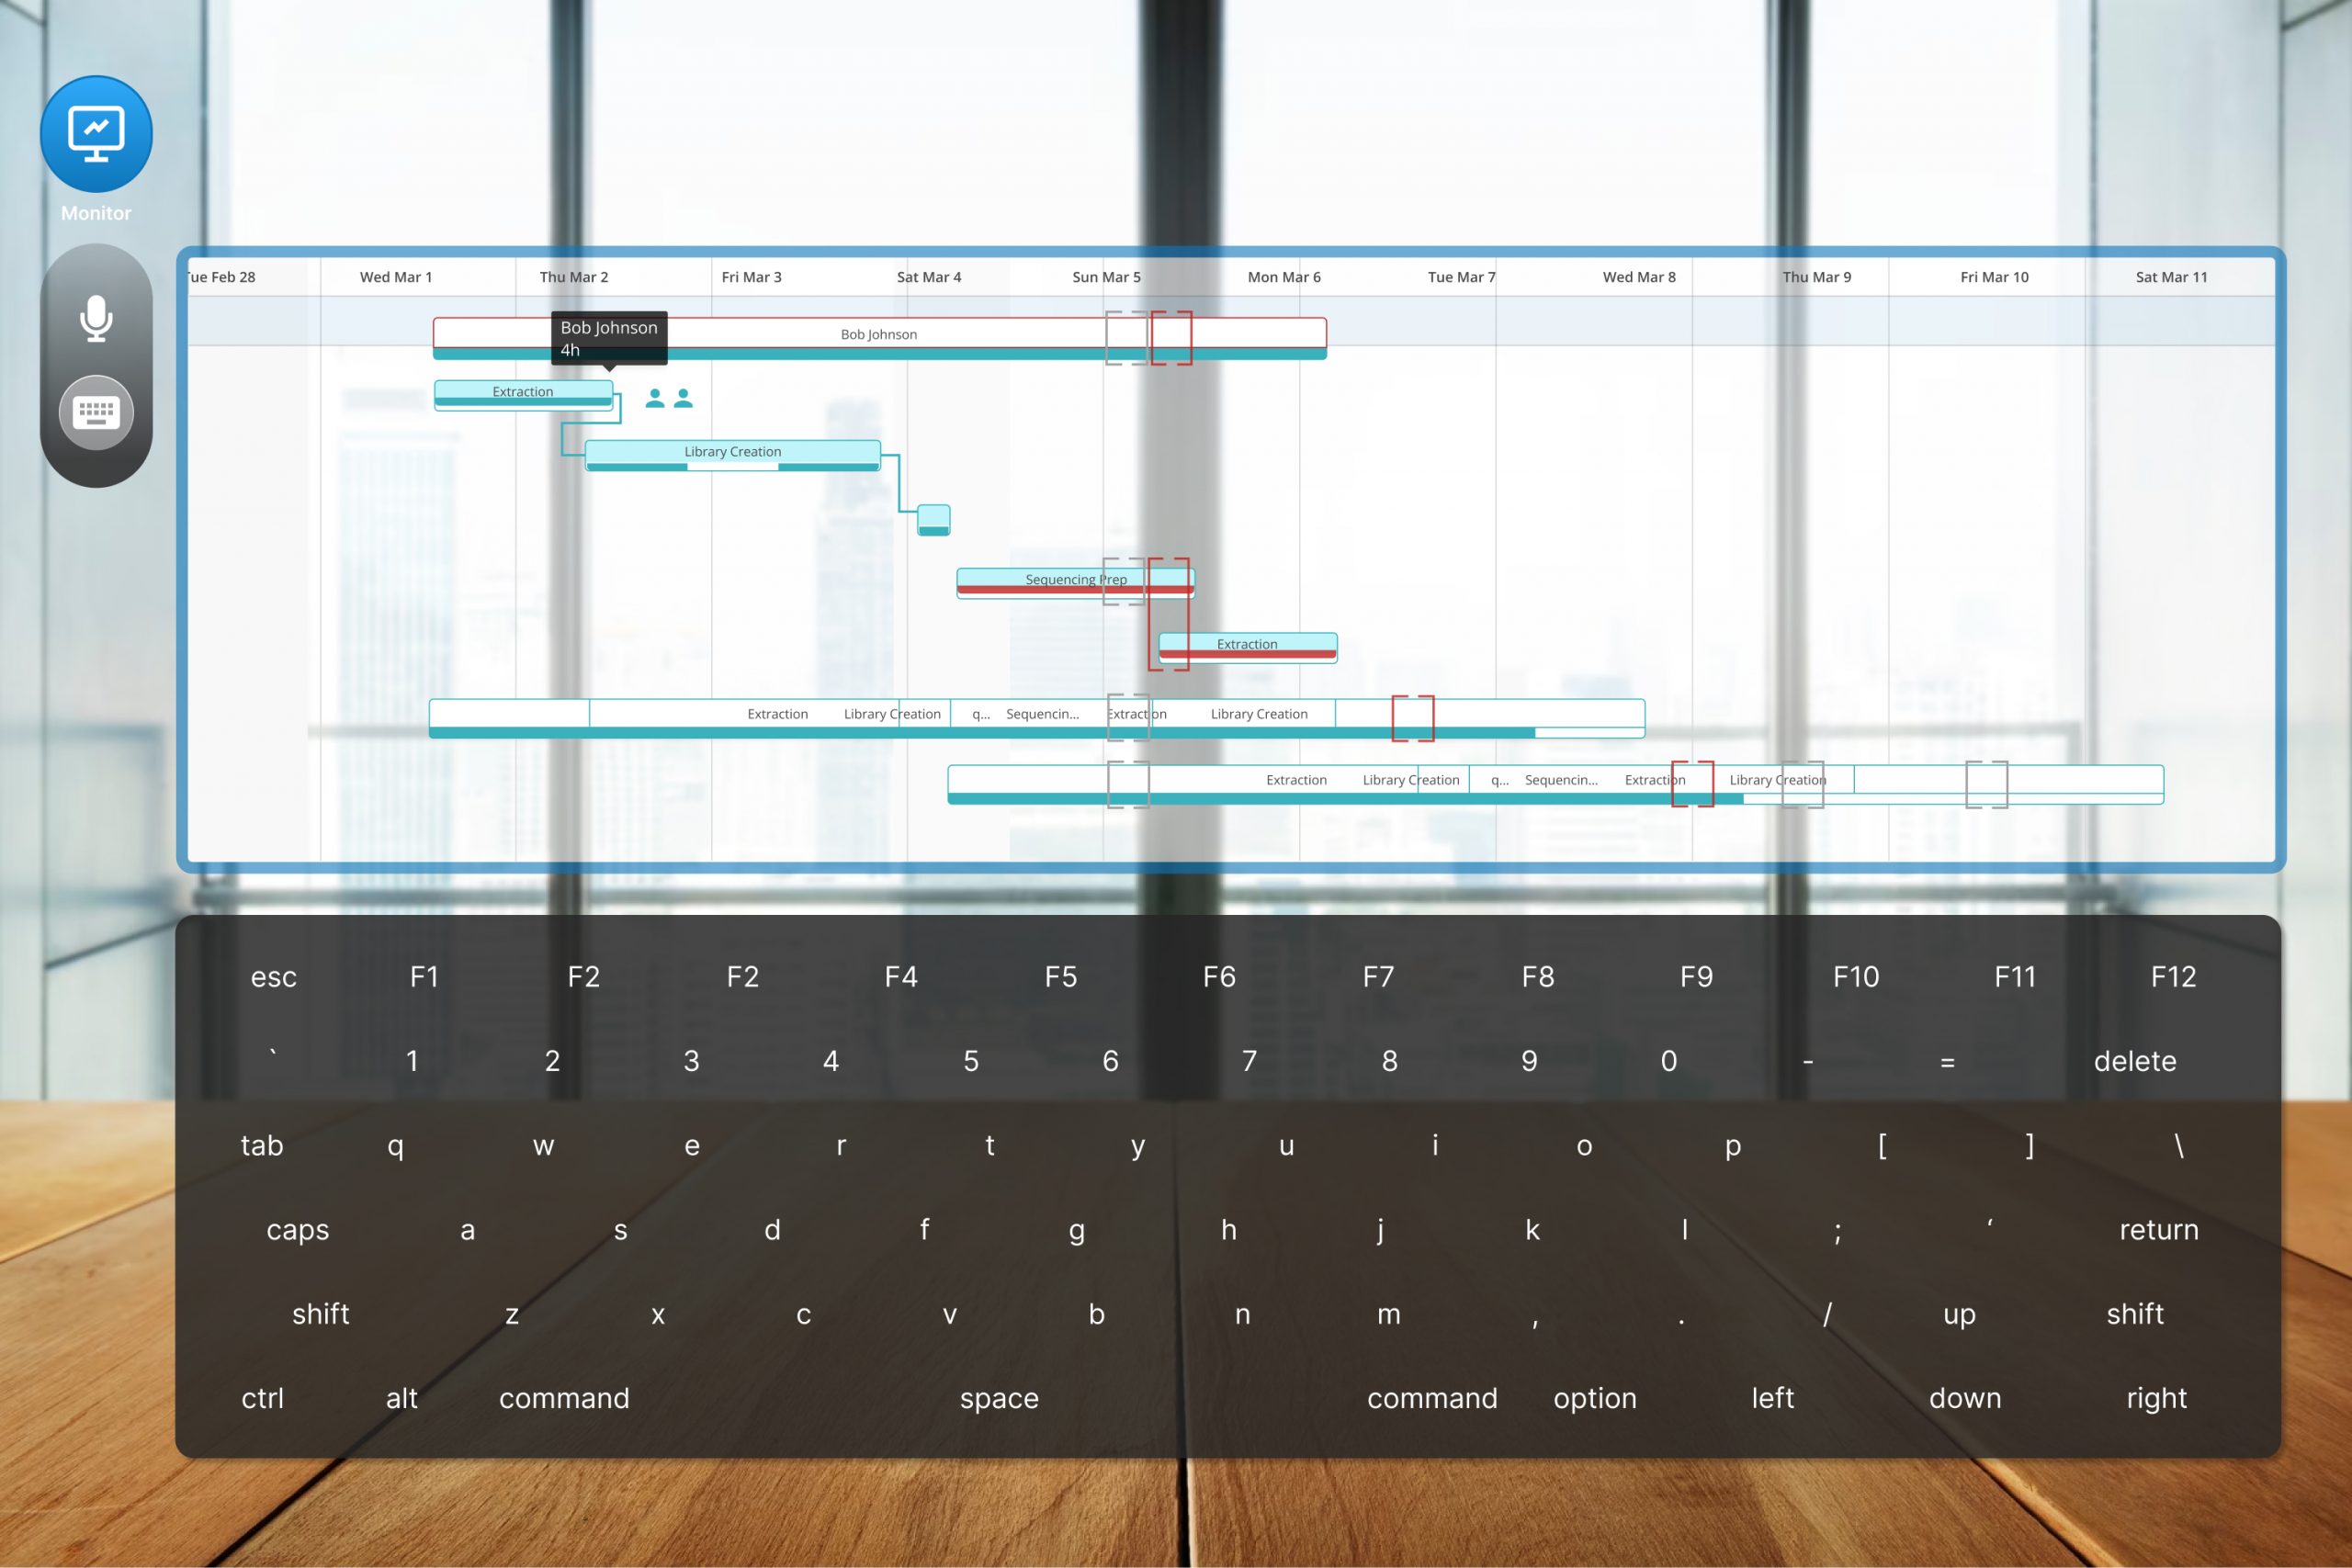
Tablets and Mobile Devices adds mobility, connectivity, and ease of use that can significantly improve efficiency, productivity, and accuracy but require different sets of usability. This is where I designed tablet specific flows and layouts to maximize the productivity whether the user is in the manufacturing floor or clean room with PPE.
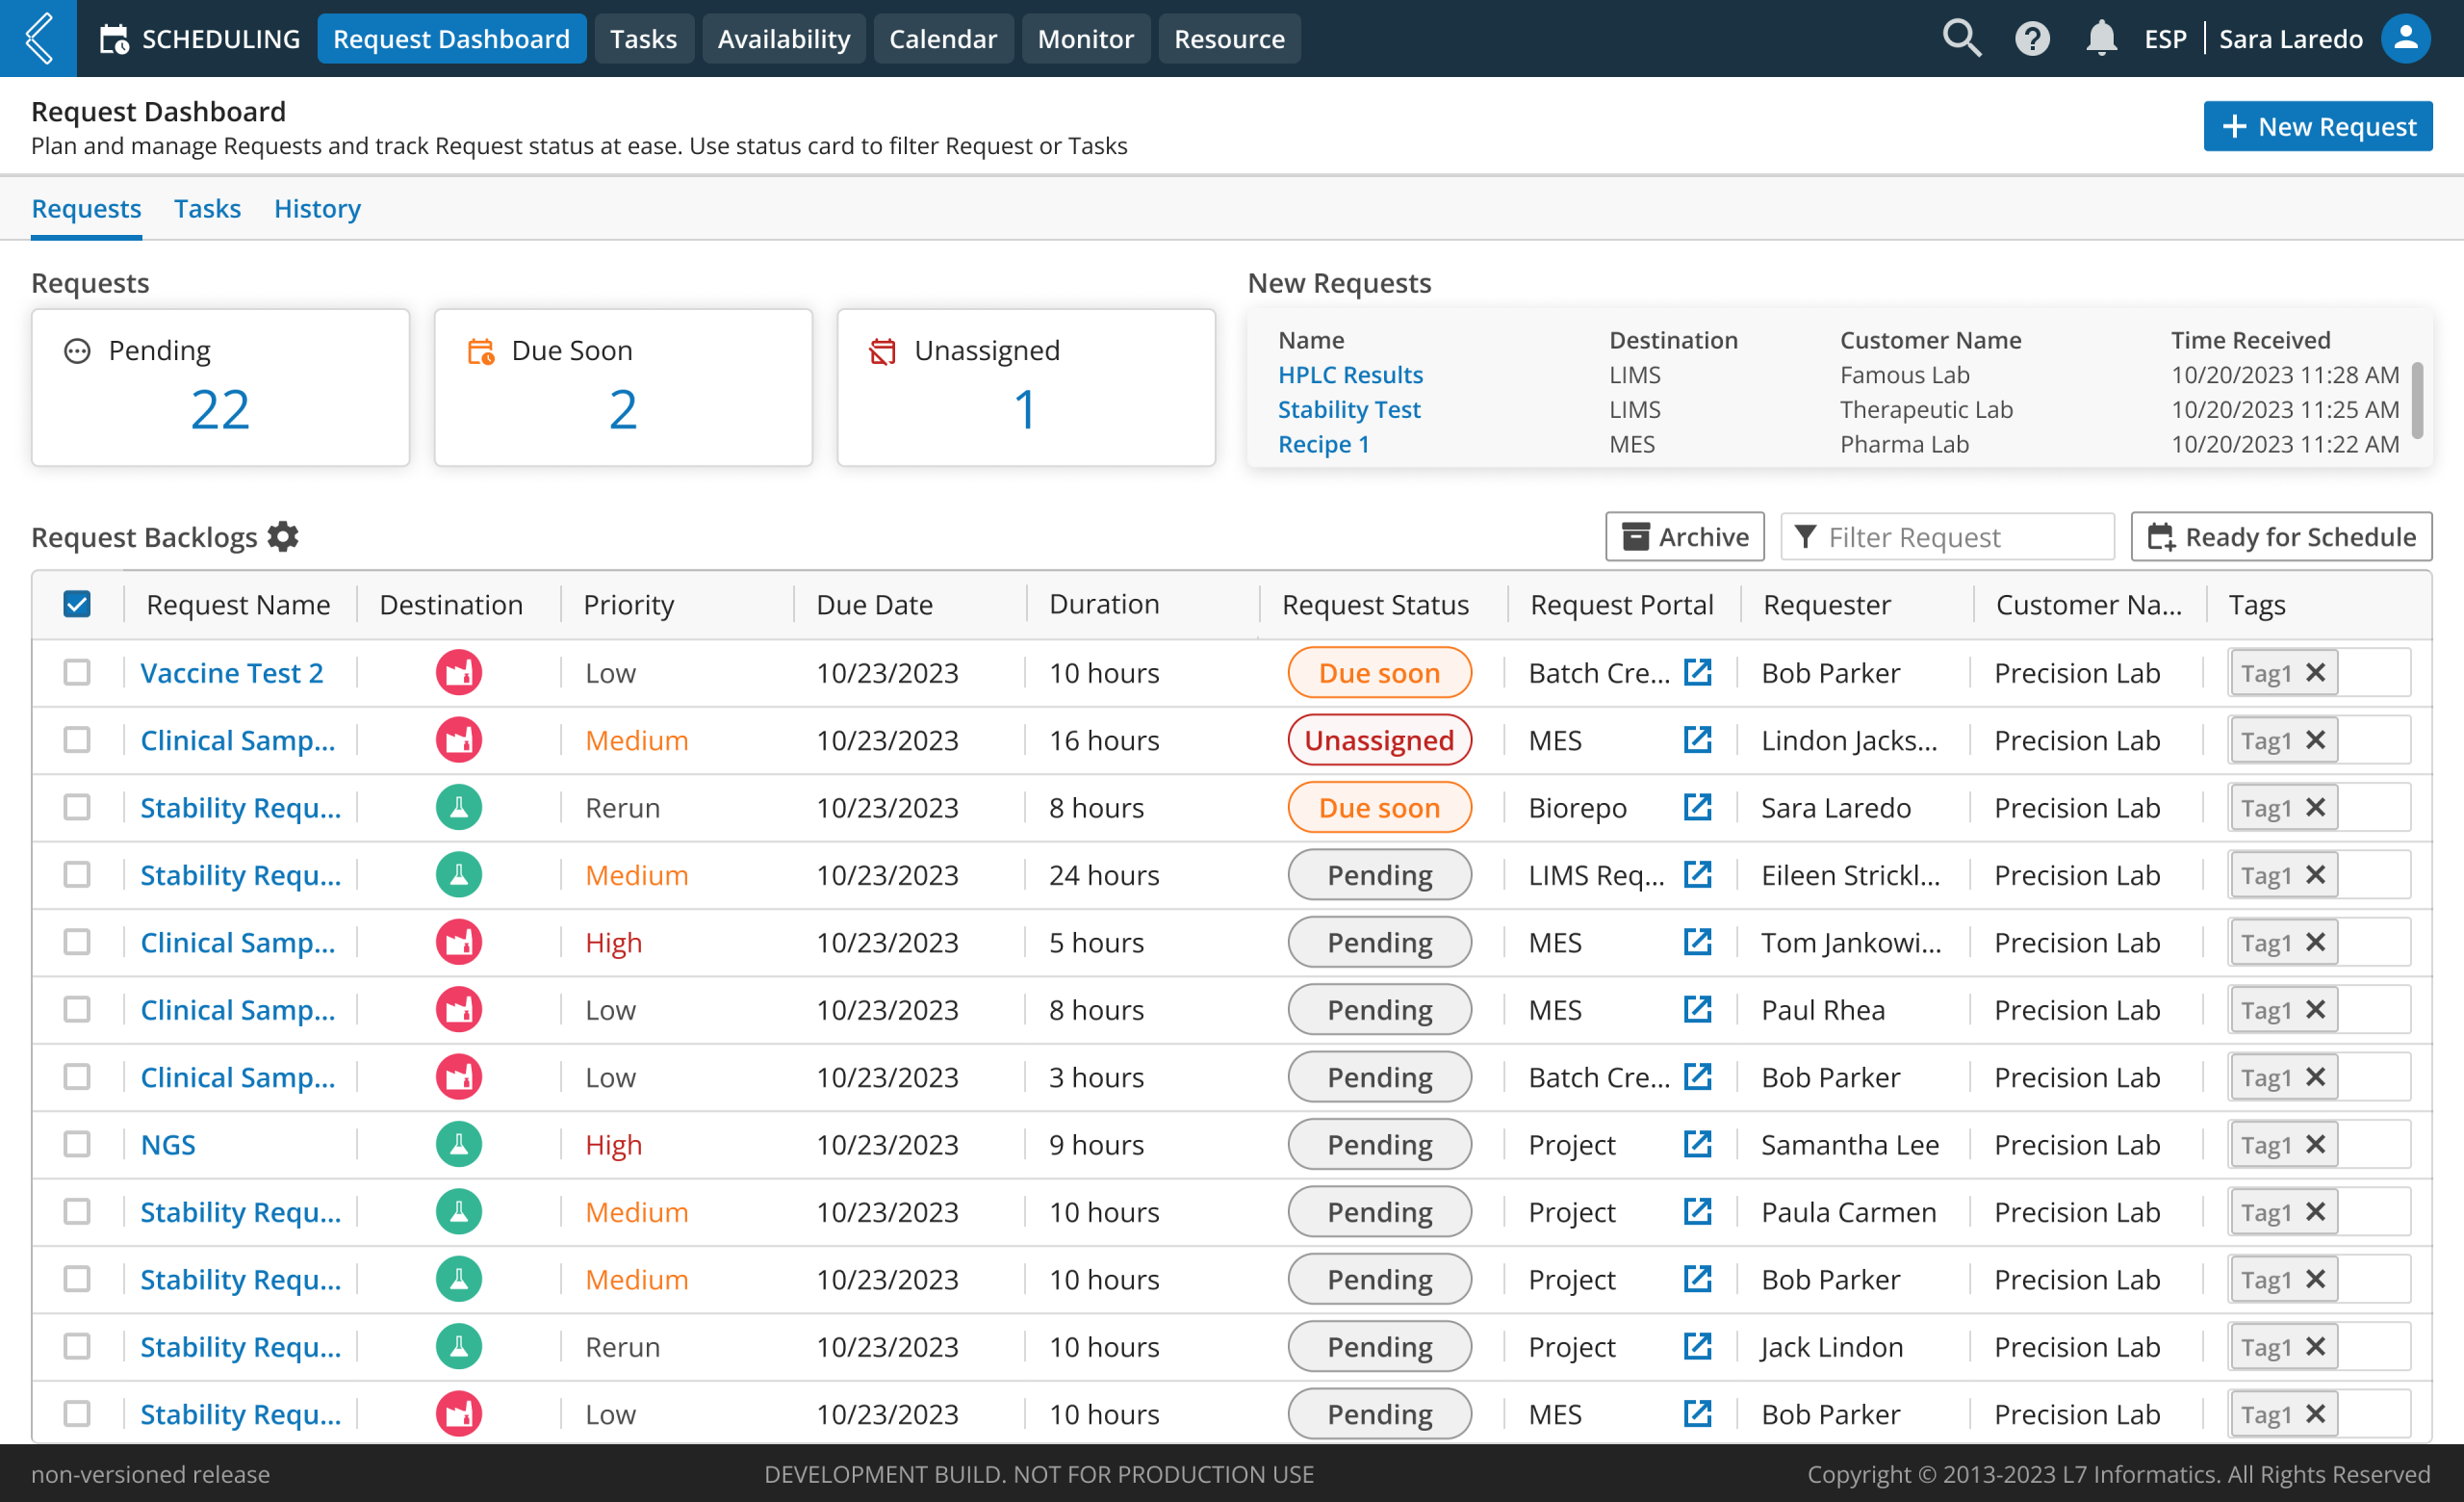
PERSONA BASED INTERFACE DESIGN
– Tailored View for each Persona
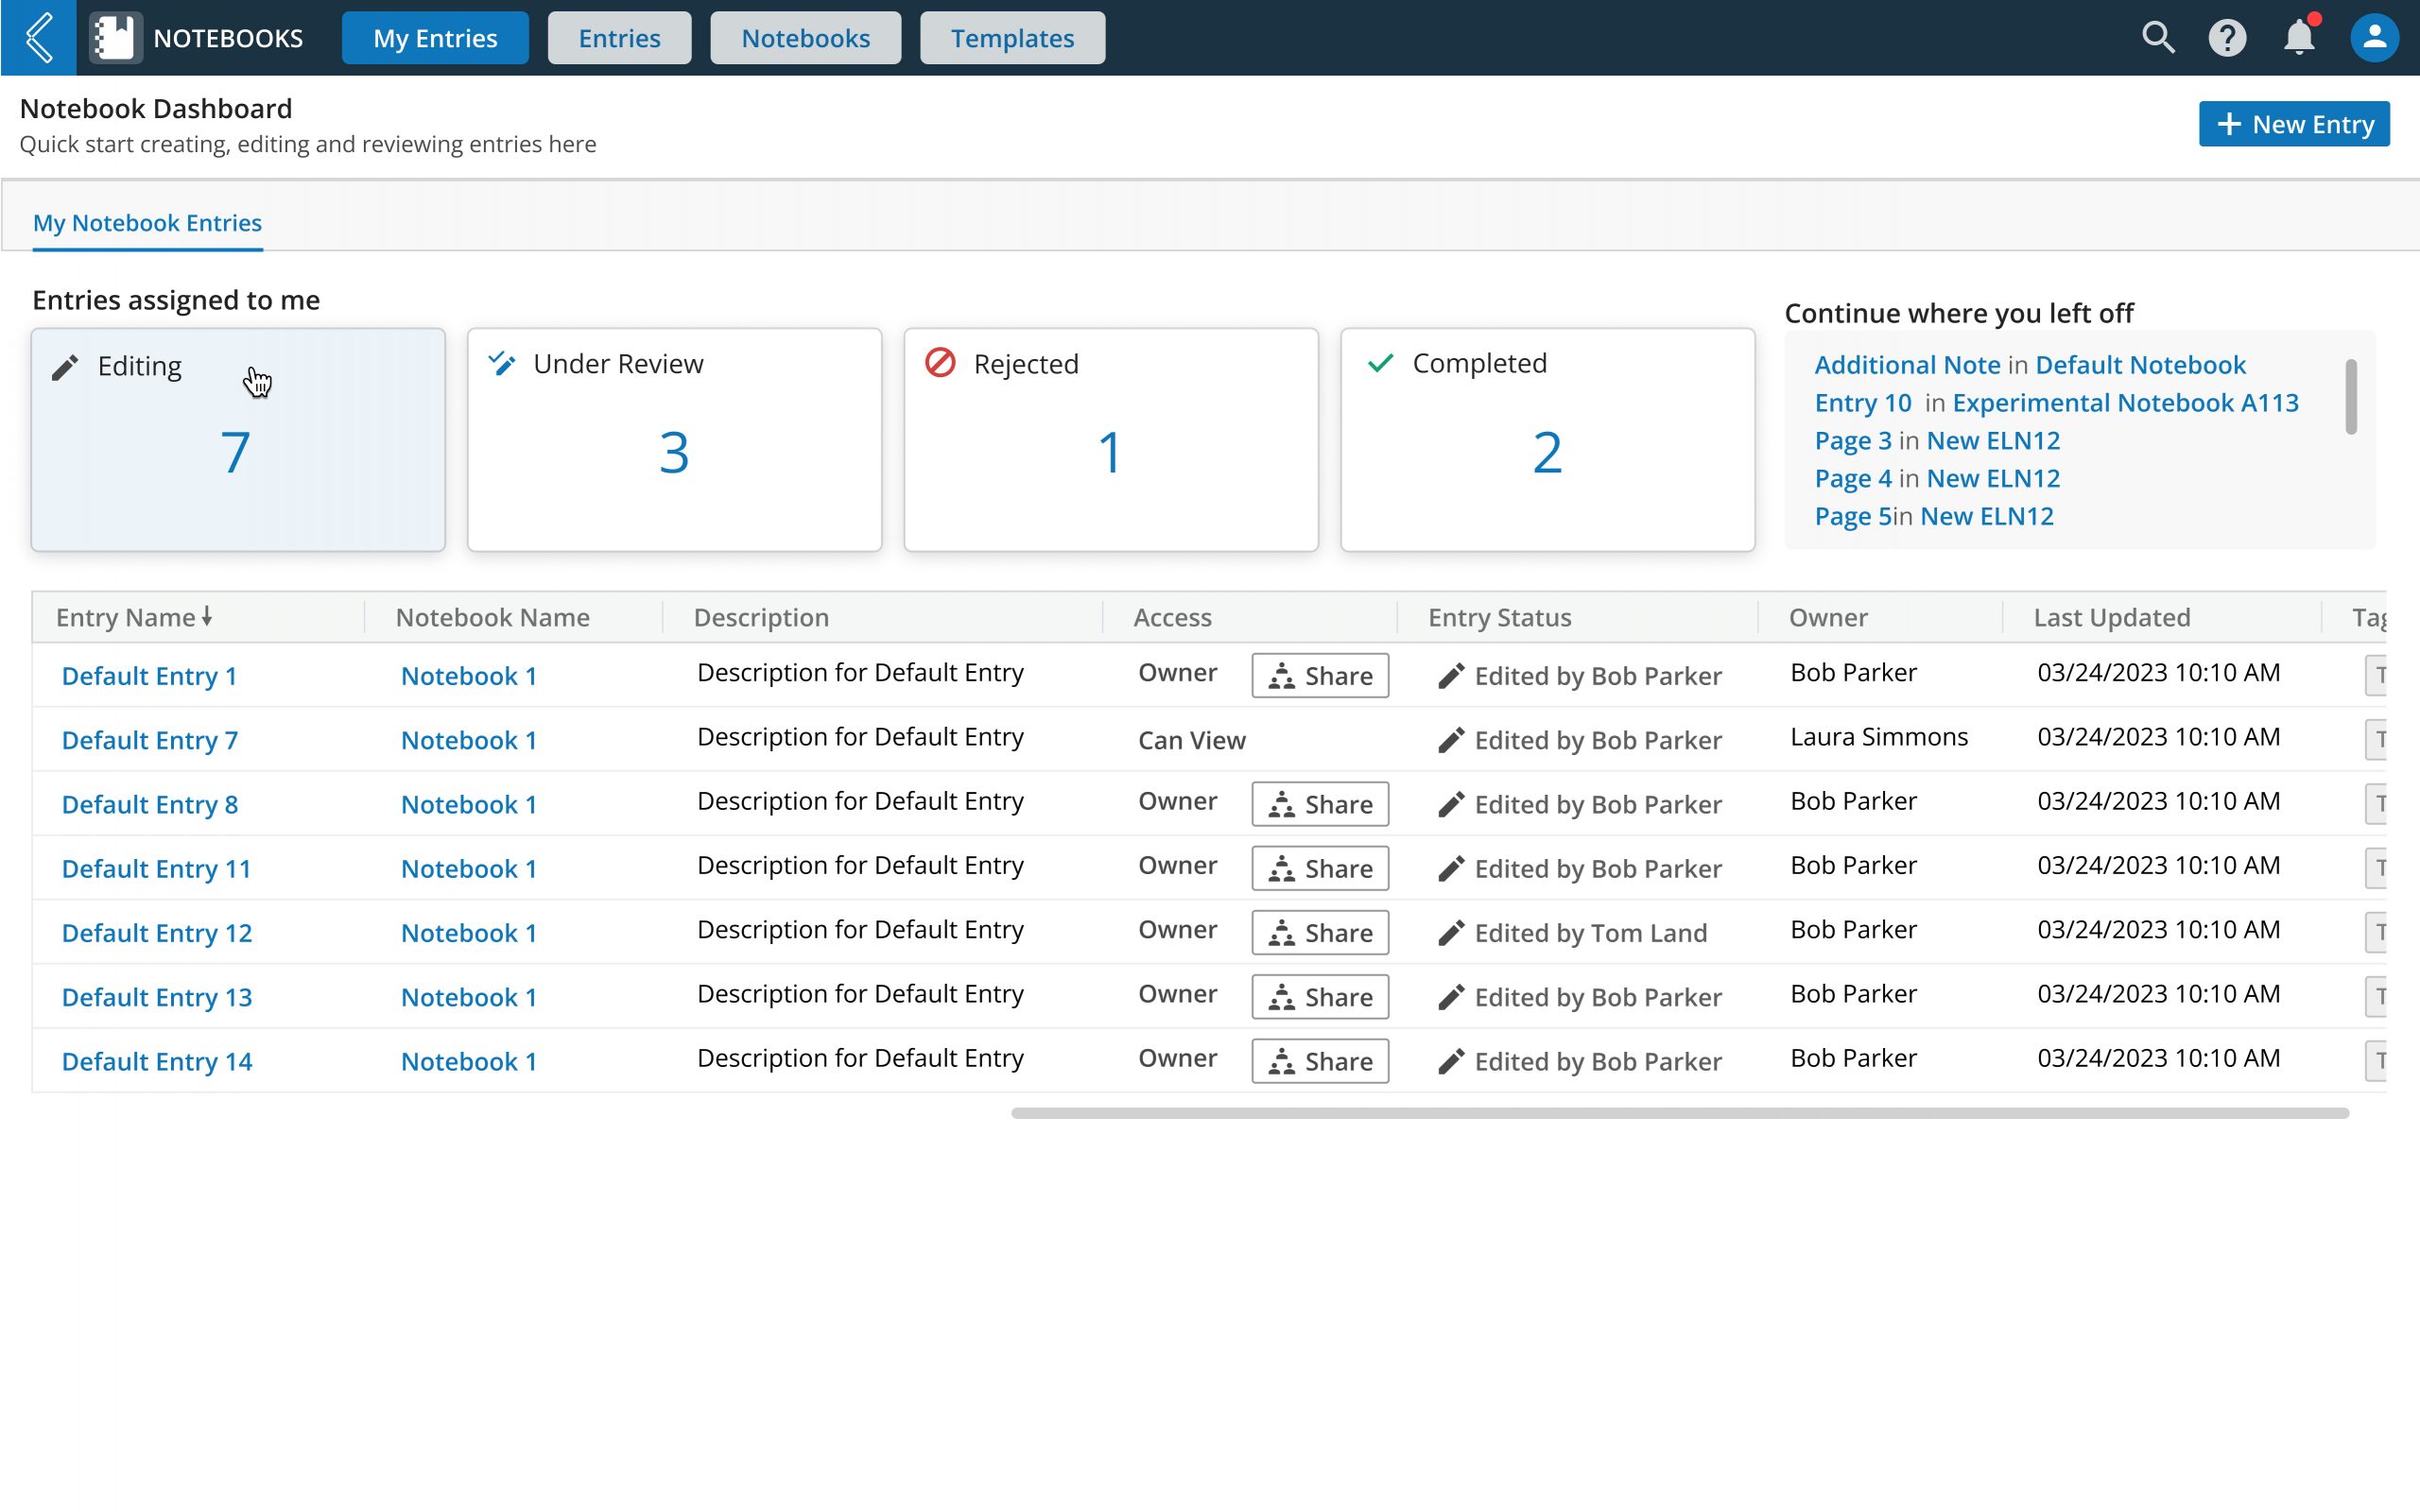
Whether you’re an editor or a reviewer, it’s crucial to see data tailored to your role, so you can focus on what matters most—without wasting time searching for it. That’s why I introduced a dynamic card system that not only shows the number of tasks assigned to you, but also acts as a smart filter. Each card delivers detailed insights on content and version, making it crystal clear when you’re comparing items for review—no more guesswork, just a seamless, efficient experience!

